SOLIDWORKS 2019
Declassified: New Products and Features
DECLASSIFIED: SOLIDWORKS 2019
The tools to help you go from design to manufacturing at lightning speed. Watch the full unveiling by GoEngineer:
- New features and enhancements will get you from concept to manufactured faster than ever before.
- System-wide performance improvements so good they have to be seen to be believed.
- Advanced Technologies: New functionality that takes advantage of the latest in hardware development.
- All these plus many more!
Deep Dive Videos
Get a detailed look at new features & enhancements to SOLIDWORKS 2019
SOLIDWORKS CAD
SIMULATION
Electrical Design
COMMUNICATION & DATA MANAGEMENT
VISUALIZE
Manufacturing
2019 Data Sheets & Brochures
- 3D Content Central Data Sheet
- 3D CAD Data Sheet
- Apps For Kids Data Sheet
- CAM Data Sheet
- Composer Data Sheet
- DraftSight Data Sheet
- eDrawings Data Sheet
- Electrical Data Sheet
- Flow Simulation Data Sheet
- Industrial Designer Data Sheet
- Inspection Data Sheet
- Manage Data Sheet
- Model-Based Definition (MBD) Data Sheet
- MySOLIDWORKS Data Sheet
- PCB Data Sheet
- PDM Data Sheet
- Plastics Data Sheet
- Simulation Data Sheet
- Subscription Service Program Data Sheet
- Visualize Data Sheet
Additional Resources
Take Advantage of GoEngineer’s Extensive Knowledge Base and Resources

Find a Solution
Our robust Knowledge Base contains over 12,000 resources to help answer your product design questions. From basic CAD questions to in-depth guides and tutorials, find your solution here. Find a Solution

PROFESSIONAL TRAINING
Improve your skills with professional training and certifications in SOLIDWORKS, CAM, 3D Printing, and 3D Scanning offered four ways: self-paced, online, on-site, or in-classroom. Certified Training Courses

BLOG
#1 Technical Resource Worldwide - Right at your fingertips. Search or browse through hundreds of SOLIDWORKS tips & tricks, additive manufacturing product developments, announcements, how-to guides, and tutorials. Blog
YouTube Channel
Our YouTube channel hosts hundreds of educational tutorials, product demonstrations, recorded webinars, and best practices for all of our products and services. GoEngineer's YouTube Channel
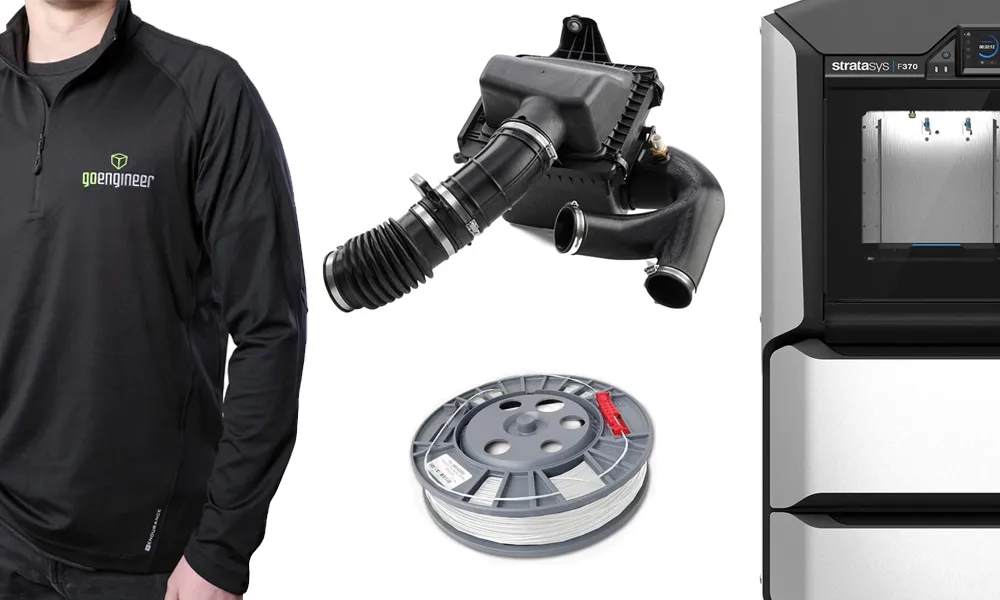
ONLINE STORE
Order 3D printing materials and consumables, enroll in SOLIDWORKS training classes, and buy official GoEngineer gear directly from our online store. Online Store
WEBINARS
Our engineering webinars are hosted by some of the top experts in the industry. They are always recorded, always free, and always offer a live Q&A. WEBINARS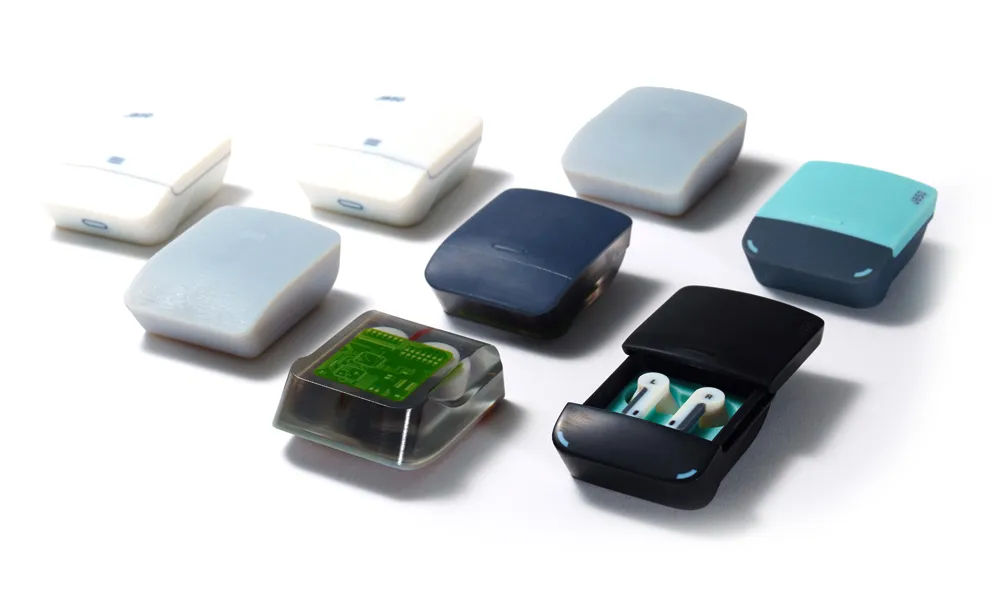
3D Printing Services
Need to 3D print a part? Our Additive Manufacturing experts will 3D print your part and deliver it to you using the latest technology on one of our professional FDM, PolyJet and SL 3D printers. 3D Printing Services
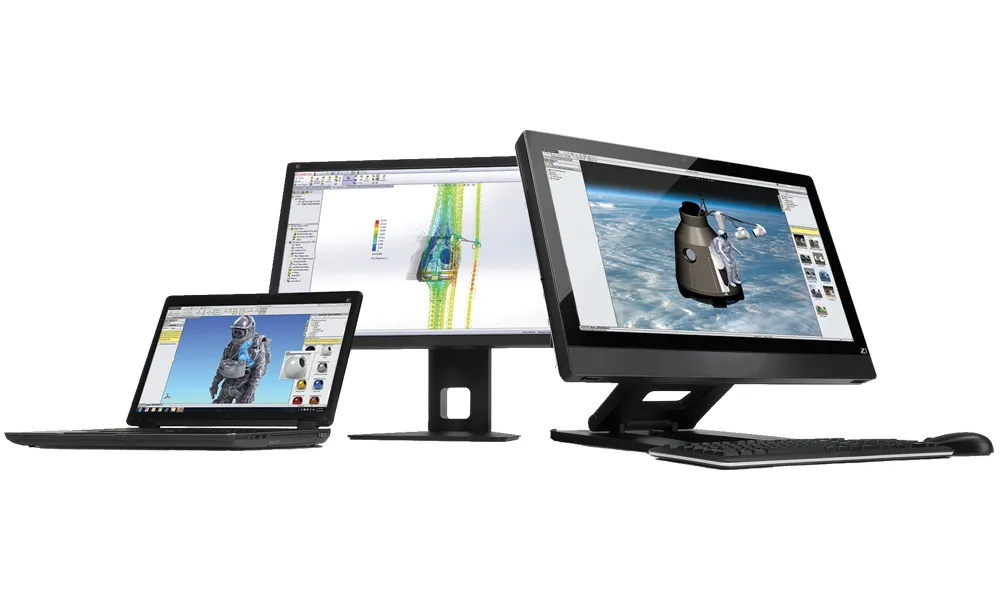
Simulation Services
GoEngineer's CAE consultants help you design better products faster. Our advanced FEA & CFD services provide critical engineering insight to world-class OEMs, suppliers, and start-ups alike.Simulation Services
×
![]()