SOLIDWORKS Simulation Gauss Points, Nodal, and Element Stress
What are Gauss Points?
Gauss points are the points within each SOLIDWORKS Simulation element where the actual analysis happens. These are the points where the stress and strain outputs of SOLIDWORKS Simulation are calculated.
The Difference between Nodal and Element Stress
SOLIDWORKS Simulation users can see nodal and element value plots by right-clicking on the plot of his/her choice then clicking edit definition. In the Advanced Options, you will see node value and element value options.
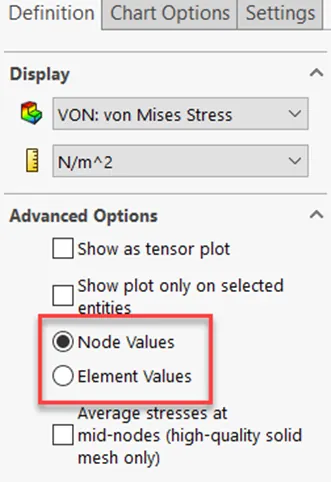
Figure 1: Location to find node values vs element values plot.
The node values appear as 'smooth' plots while the element values appear 'rough' where each element is easily distinguished from the other elements in the plot. The reason these two plot options are different is due to the Gauss points inside each element.
For the nodal value plots, after the simulation calculates the solution at each Gauss point, the data is extrapolated to the corresponding element node for that Gauss point.
One node can be connected to multiple Gauss points from different elements, so each of these point's extrapolated data is averaged at the element node connected to those Gauss points. This stress or strain averaging method creates the 'smooth' nodal stress plot results. Figure 2 below shows a node value stress plot as well as a representation of how this plot works.

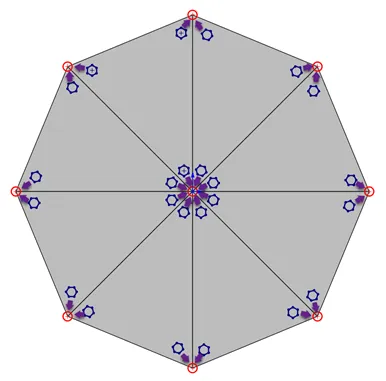
Figure 2: Top – Actual node value plot in SOLIDWORKS Simulation.
Bottom – How Guass points extrapolate their data to the closest node. The red circles are the element nodes. The blue hexagons are the Gauss points and the purple arrows are the direction the Gauss points extrapolate their data to the closest node.
For element values, on the other hand, the Gauss points calculate the same way as the nodal value plots, but instead of averaging the results at each given node, the calculated stress and strain results are averaged between Gauss points within each element.
The stress and strains calculated by the Gauss points within each element are not allowed to leave the element. This gives the element values plots their distinctive 'rough' look. Figure 3 below shows an element value stress plot as well as a representation of how this plot works.
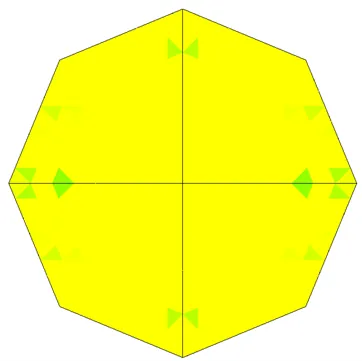
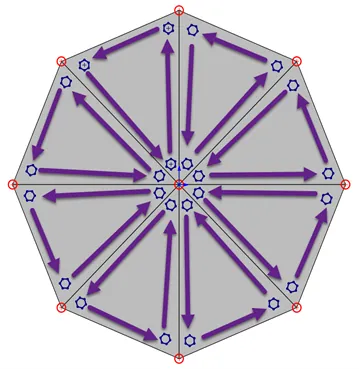
Figure 3: Top – Actual element value plot in SOLIDWORKS Simulation.
Bottom – How Gauss points extrapolate their data between each other within each element. The red circles are the element nodes, the blue hexagons are the Gauss points, and the purple arrows are the direction the Gauss points extrapolate their data within each element.
The nodal and element value plots will always be different but these differences should be reduced as much as possible as a check against inaccuracy. If these two values are very different in a location of high stress or high interest it is an indication that the mesh density in this area should be made finer to gain more accurate results from the mesh.
The Difference between First-order and Second-order mesh elements
First-order mesh elements are known as draft quality elements in SOLIDWORKS Simulation. These elements are less accurate than second-order mesh elements (also known as high-quality elements in SOLIDWORKS Simulation) for two reasons.
Reason number one is that draft quality elements are stiffer than high-quality elements and tend to add artificial stiffnesses to the simulation.
Reason number two is that draft quality elements only have one Gauss point in both the solid and shell mesh type. High-quality elements have four Gauss points in their solid mesh type and three Gauss points in their shell mesh type.
Beam mesh elements do not have first or second-order distinctions. There is only one type of beam mesh element in SOLIDWORKS Simulation.
For the two reasons listed above, draft quality elements should only be used to gain quick simulation results to get an idea of how the simulation looks and reacts. When accurate results are necessary it is advised to only use the high-quality element type.
Expand Your SOLIDWORKS Simulation Skillset
Troubleshooting SOLIDWORKS Simulation No Penetration Contact Sets Recommendations
Piecewise Nonuniform Pressure in SOLIDWORKS Simulation
Backspin is Important to Your Basketball Free Throw! A SOLIDWORKS Simulation Study
A Guide for Using Bearing Connectors in SOLIDWORKS Simulation

About Taran Packer
Taran is a SOLIDWORKS Simulation Technical Support Specialist at GoEngineer. He has a Bachelor’s degree in Biomedical Engineering from the University of Utah. Taran enjoys learning about different tools in SOLIDWORKS Simulation, Flow Simulation, and Plastics.
Get our wide array of technical resources delivered right to your inbox.
Unsubscribe at any time.