SPC with Polyworks Inspector
The Polyworks Inspector software has a very robust and powerful Statistical Process Control (SPC) tool built into it. This is very useful for measuring the repeatability between multiple pieces. It allows you to quickly and easily evaluate your manufacturing process for predictability and quality. Polyworks Inspector SPC offers two different flavors: Object Control SPC and Surface Data SPC. Object Control analyzes object dimensions like diameter, Flatness, and lengths for repeatability. Surface Data SPC analyzes the part shape using color maps.
Making SPC charts is very easy. First you need to have a finished inspection report made and have ran it on more than 1 piece, so you have something to compare against. Then you can select all the specific measurements that you want to evaluate and click the SPC button. All relevant charts will be created automatically and be ready for you to create and evaluate reports from, all within Polyworks. Adjusting the sample size will determine what kinds of charts get generated as well.
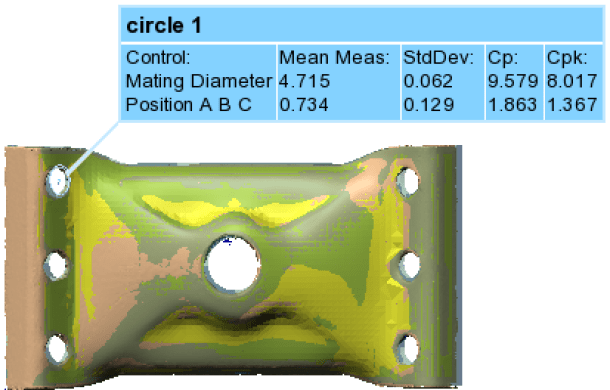
Statistics for the piece can also be shown on annotations.
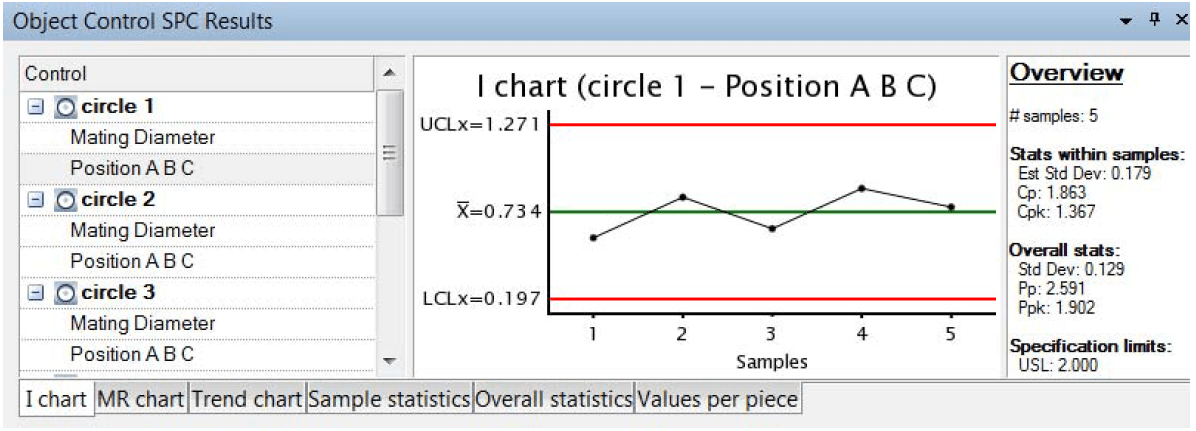
On top of several statistic tables you will get a few different charts. A sample size of 1 will give you Individual (I) charts, Moving Range(MR) charts, and I-MR charts. If you make the sample size greater you will get Mean (Xbar) charts, Range(R) charts, and Trend charts.
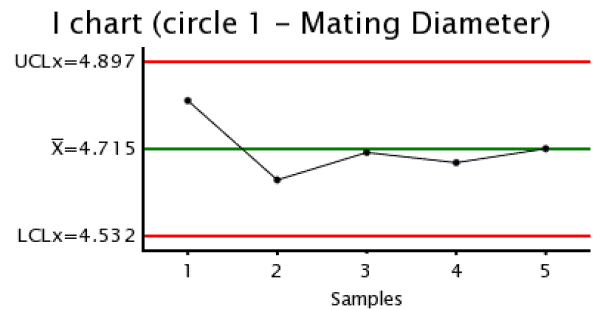
To go into more detail on what these charts mean: Individual (I) charts display the Measured Value per piece and the Mean of those values.
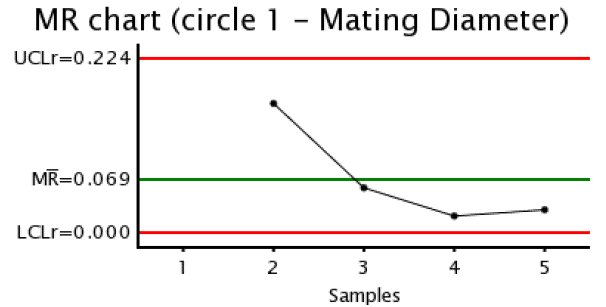
Moving Range (MR) shows the moving range from the previous Piece and the mean of the variations.
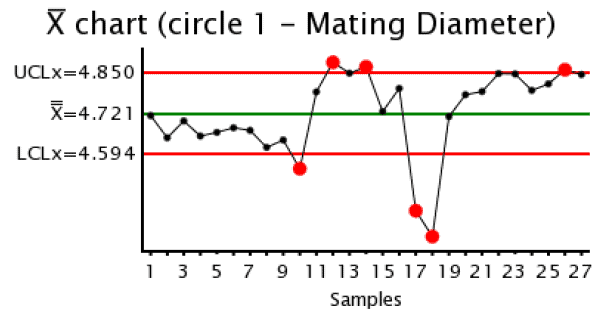
Mean (Xbar) shows the average value per sample and the mean (for sample size greater than 1).
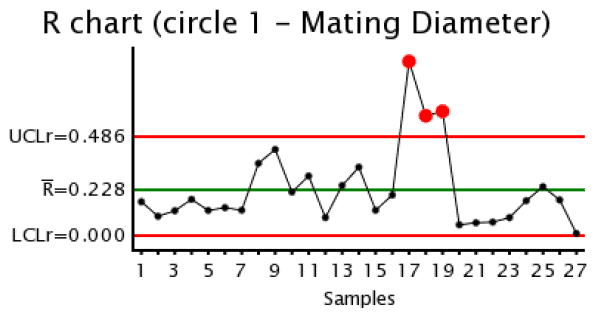
Range (R) shows the range of data in each sample and the mean of those ranges (for sample size greater than 1).
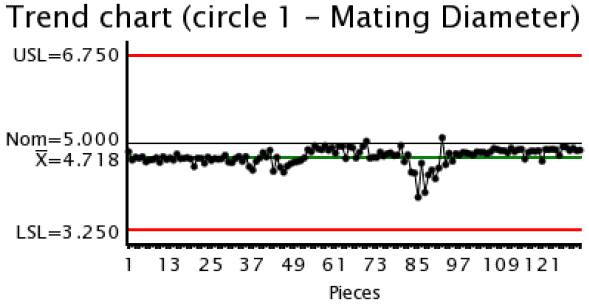
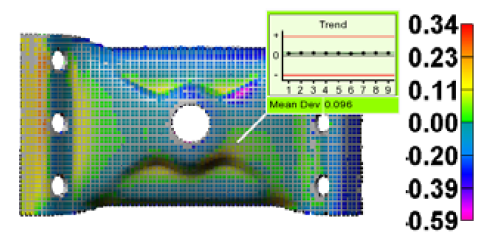
Trend Charts display the measured value of the object and the mean value.
The statistics tables give a breakdown of these measurements in table format per piece and overall.
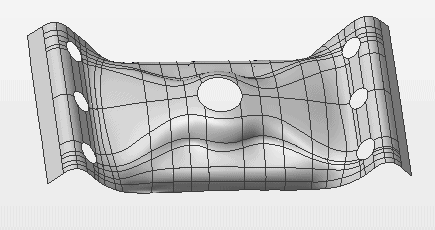
The Surface Data SPC analyzes the range in shape across multiple pieces. The results are displayed on a color map of the part. The results include range of variation, mean deviation, and highest deviation area, to name a few.
Tim Crennen
Applications Engineer, 3D Printing and 3D Scanning
Computer Aided Technology, Inc.