Fatigue Analysis of a Landing Gear using SOLIDWORKS Simulation
It is observed that repeated loading and unloading weakens objects over time even when the induced stresses are considerably less than the allowable stress limits. This phenomenon is known as fatigue. Each cycle of stress fluctuation weakens the object to some extent. After a number of cycles, the object becomes so weak that it fails. Fatigue is the prime cause of the failure of many objects, especially those made of metals. Examples of failure due to fatigue include, rotating machinery, bolts, airplane wings, consumer products, offshore platforms, ships, vehicle axles, bridges, and bones.
Linear and nonlinear structural studies do not predict failure due to fatigue. They calculate the response of a design subjected to a specified environment of loads and restraints. If the calculated stresses are within the allowable limits, they conclude the design is safe in this environment regardless of how many times the load is applied.
Failure due to fatigue occurs in three stages:
Stage 1: One or more cracks develop in the material. Cracks can develop anywhere in the material but usually occur on the boundary faces due to higher stress fluctuations. Cracks can occur due to many reasons. Imperfections in microscopic structure of materials and surface scratches caused by tooling or handling are some of them.
Stage 2: Some or all cracks grow as a result of continued loading.
Stage 3: The ability of design to withstand applied loads continue to deteriorate until failure occurs.
Since Fatigue cracks start (typically) on the surface of a material. Strengthening the surfaces of the model increases life of model under fatigue events.
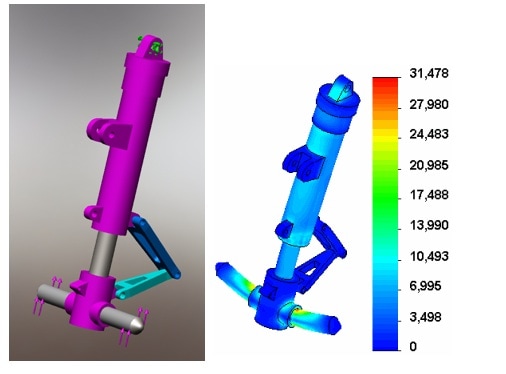
Using SOLIDWORKS Simulation user can study the effect of a single load. In this case we study landing gear mechanism. Note the wheels are not modeled. A total bearing force of 6000 lbs is applied to the faces that connect the wheel to the axle.

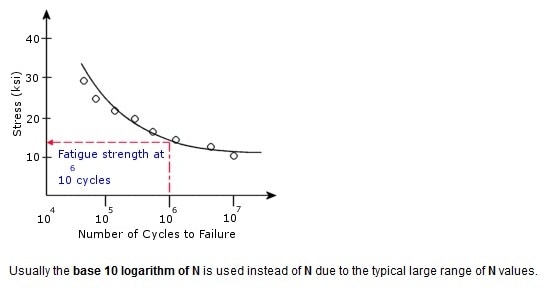
S N Curve or Alternating stress versus number of cycles required to cause failure at a given stress ratio is required to define material failure due to fatigue. A SN curve is based on stress ration or mean stress. The software uses linear interpolation to extract data when you define multiple SN curves for a material. A typical SN curve is shown in figure below

SOLIDWORKS Simulation enables users to define different types of fatigue events: constant amplitude and variable amplitude.
Constant Amplitude Events
All cycles of a constant amplitude event have the same alternating and mean stresses. A constant amplitude fatigue event is fully defined by an alternating stress, mean stress (or stress ratio), and the number of cycles. A fatigue event can refer to one or more static studies, or to a particular solution step from nonlinear or modal time history dynamic studies. The software calculates the worst alternating stress levels for each event.
Variable Amplitude Events
A variable amplitude fatigue event is a load history record that defines the fluctuation history of load. The time values do not play any role for fatigue studies with a single variable amplitude event. In this case, it is adequate to define the amplitude sequence.
Fatigue results
SOLIDWORKS Simulation gages fatigue on two parameters

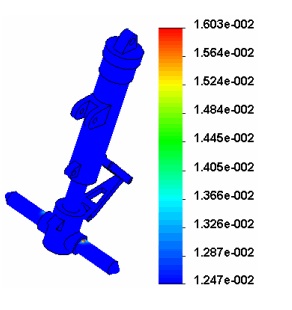
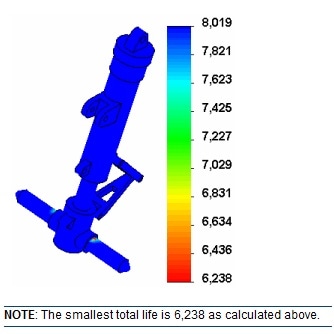
Damage factor indicate the specified event consumes x% of the life. The maximum damage show 0.016% The damage plot shows that the axle is likely to fail due to fatigue failure after 1/(max damage) = 1 / 1.6 x 10-4 = 6,238 blocks (repeats) of the specified variable-amplitude loading event. This result is verified by the total life plot as shown in the next procedure.
Based on damage total life of the mechanism can be figured out

Rajat Trehan
Product Manager – Design Validation
Computer Aided Technology Inc.

 Blog
Blog