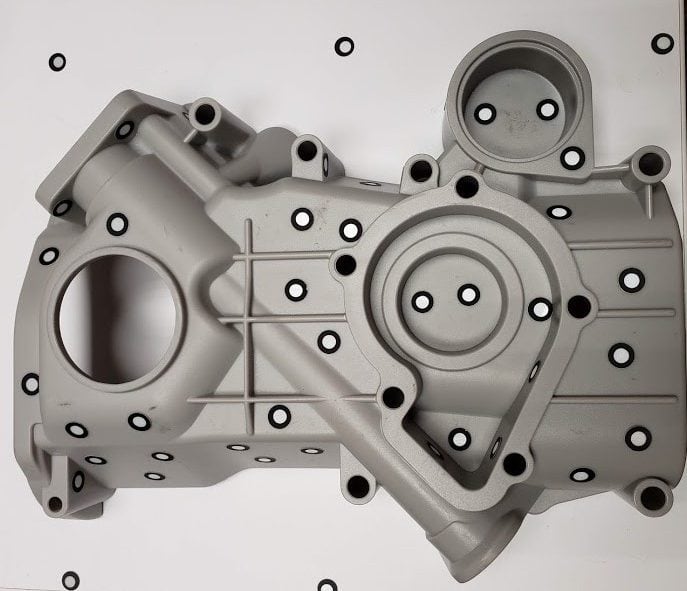
Creaform Scanning with HandySCAN 700
How fast can you scan a part?
Some of the most common questions asked during a Trade Show Creaform Product demo fall along this thread: “How fast is the scanner?” “What does a 1min scan look like?” “Can you get good data in under a minute?” “What if I only care about this one section of the part, will that speed up the process?”
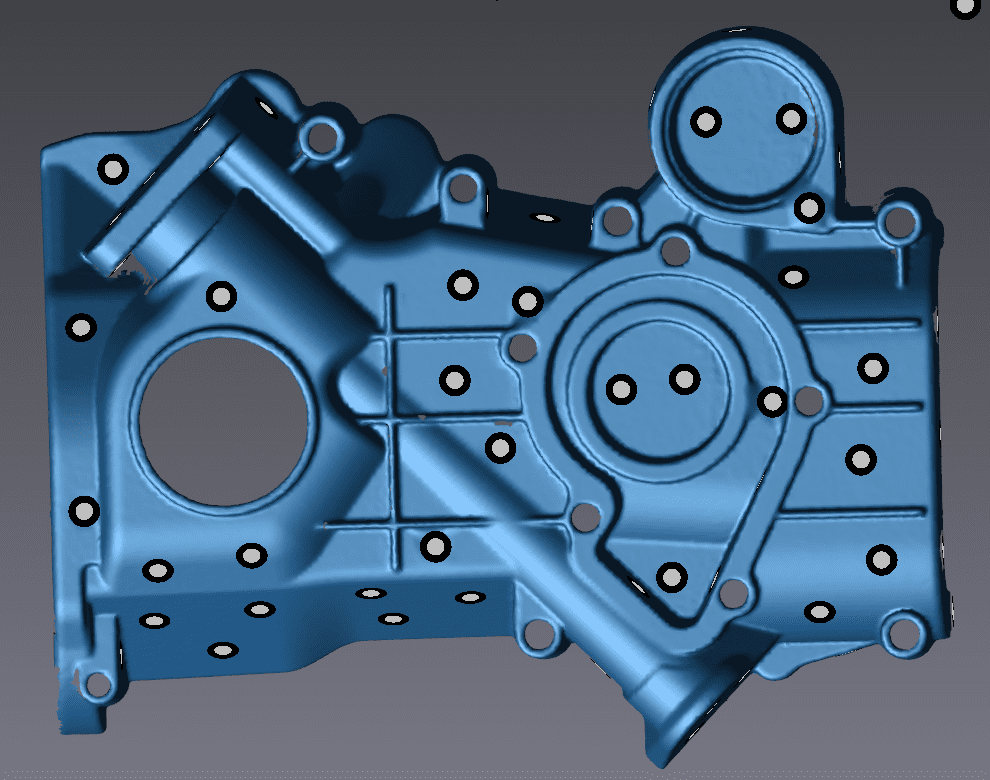
In order to better understand their needs, I ask about their current measurement methodology. I also ask about their concern for scanning speed, and the steps taken to ensure efficiency. The HandySCAN 700 collects 480,000 measurements per second, which makes it one of the fastest Metrology grade scanners on the market while maintaining a 0.0012 in accuracy. (Read more about Handyscan 700 here). Statistics are not enough, and clients want to see the scanner in action. Therefore, we take the Handyscan on a speed challenge.
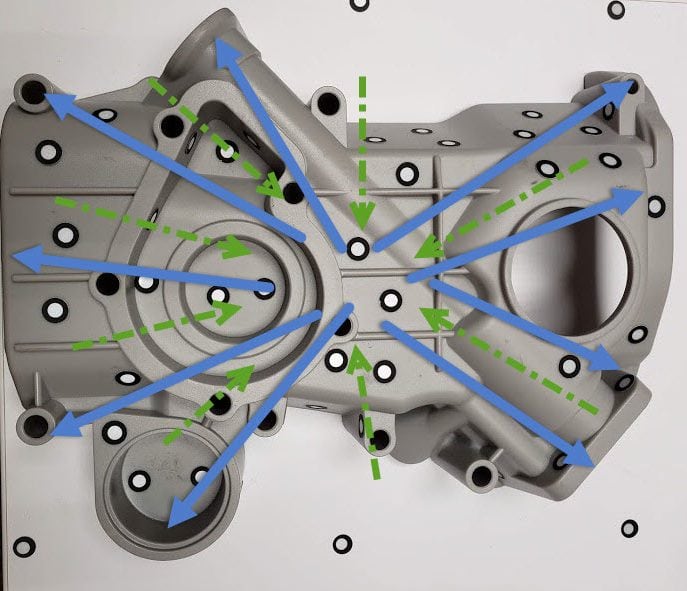
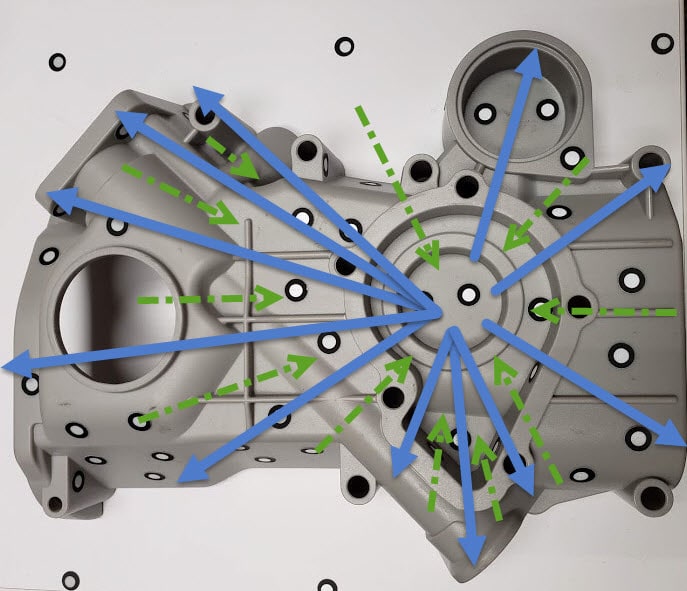
The first step, in this speed challenge, is to lay out the rules and methodology. The primary objective is to measure the key regions. (Highlighted below). The secondary objective, a tiebreaker, is to gather the surrounding data to complete the scan. (Using these Scanning Tips)
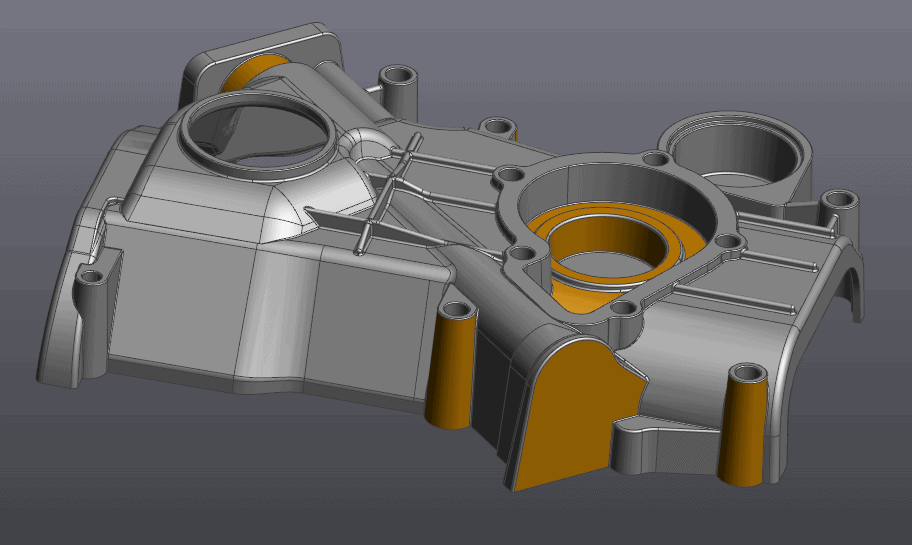
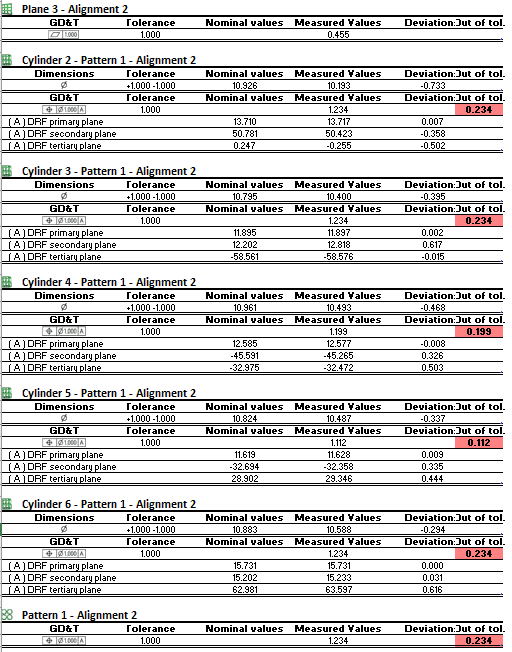
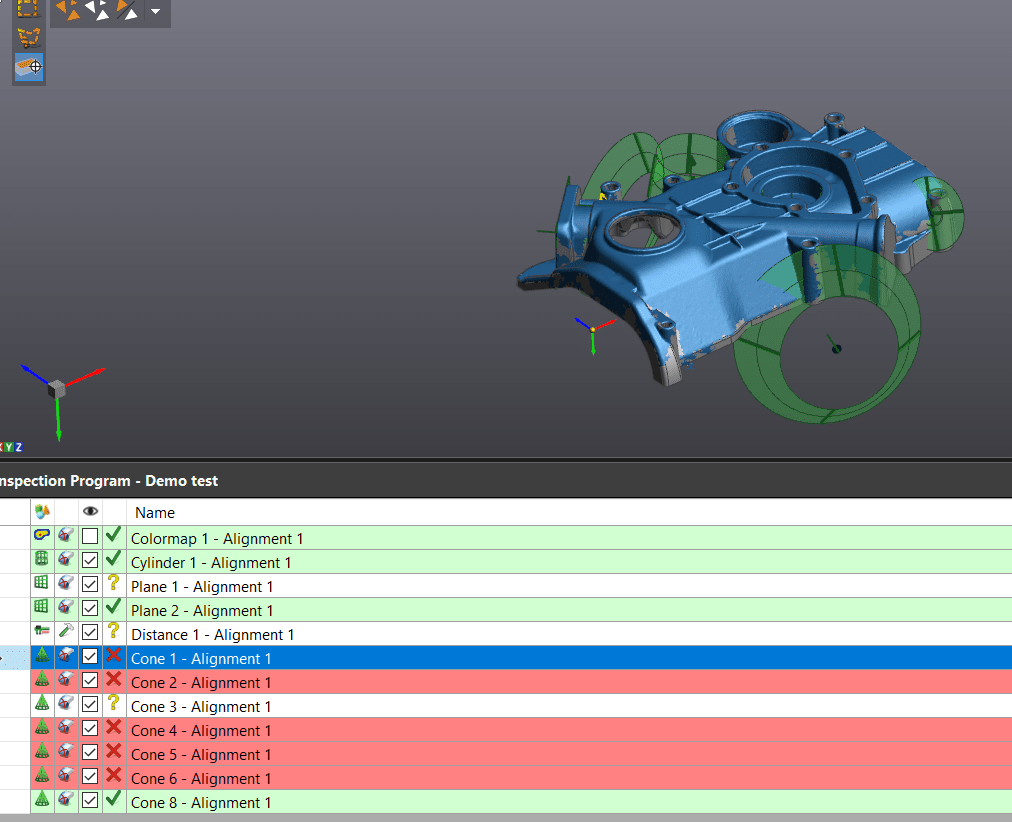
Below are our critical points to ensure our success, which will be measured using an automated 12 point report via VX Inspect. (Read more Colormap, the Quick Go/No-Go of Inspection)
Method 1:
Begin a horizontal grid pattern by sweeping the scanner left to right. Then begin a vertical grid pattern, by sweeping the scanner up and down.
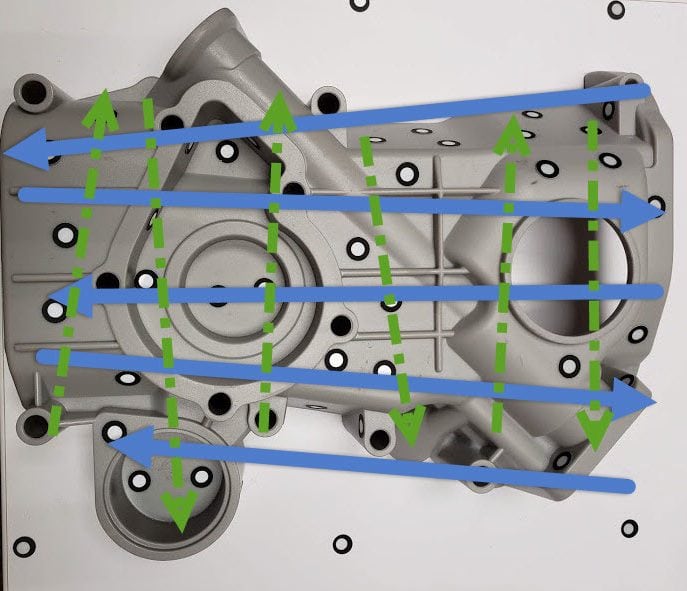
Method 2:
Complete a Spiderweb or Snowflake (depending on the season) pattern by starting at the center of the part, then branching out, and then index over a little and then sweep back towards the center. Repeat until you have encircled the entire part.
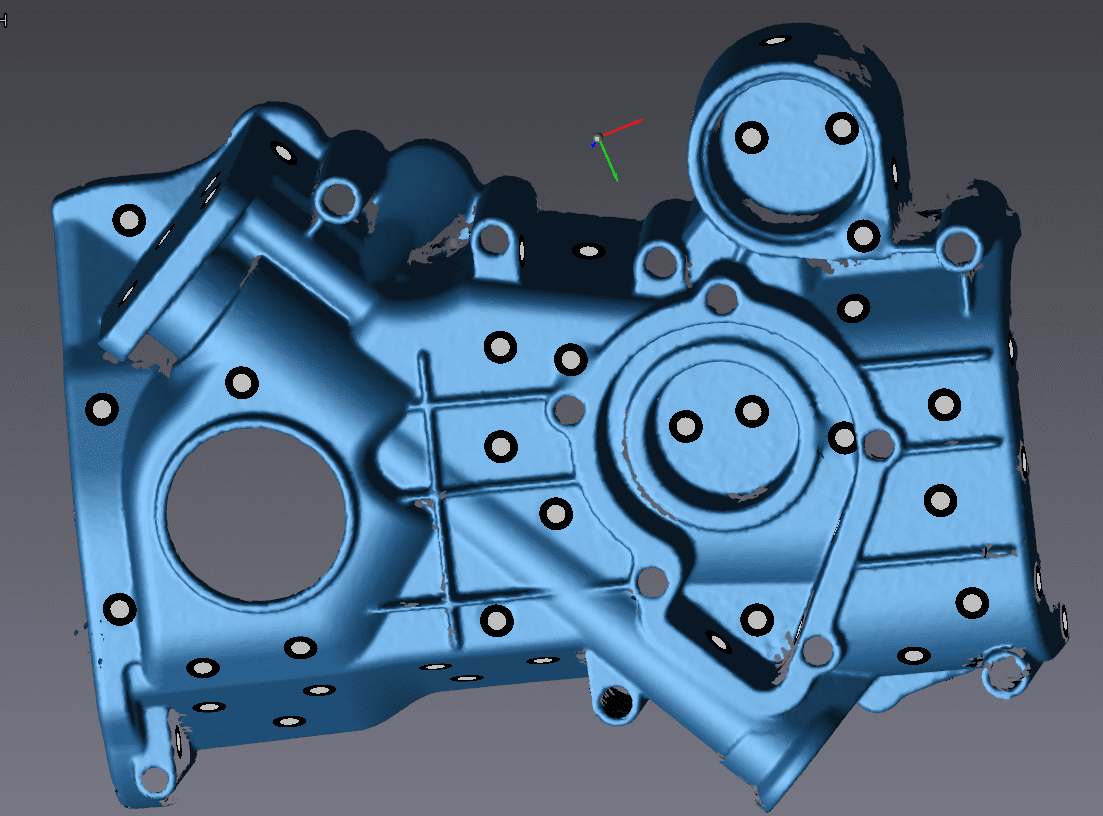
30 Sec Method 1:
Even with a 30 second time constraint, we can gather a good chunk of data using the Method 1 scan strategy. We were able to measure 6 of the 12 critical features.
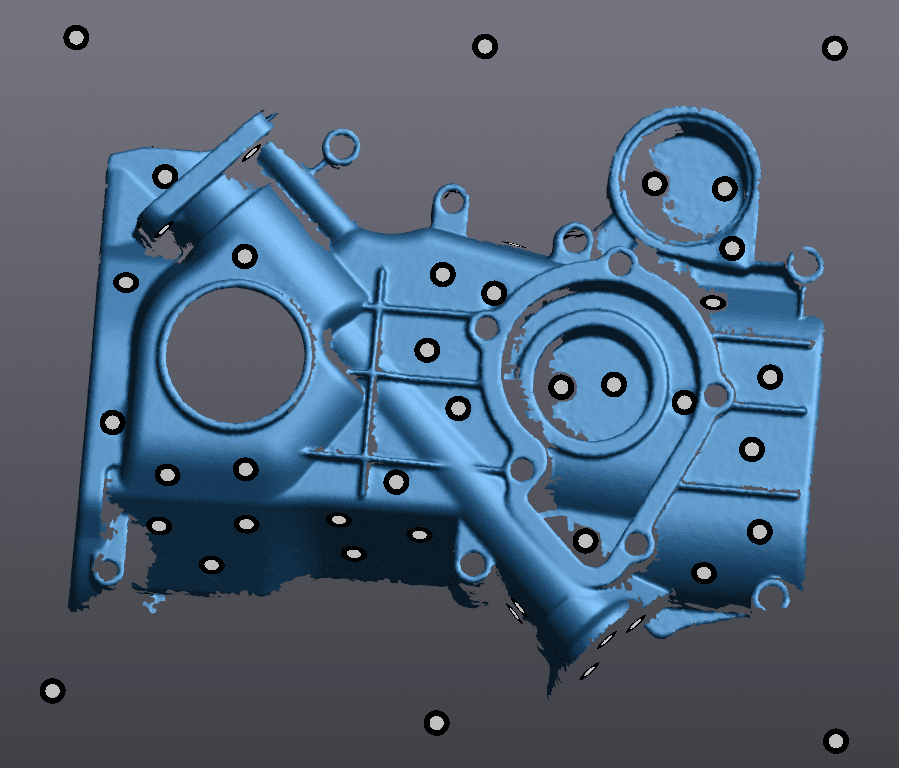
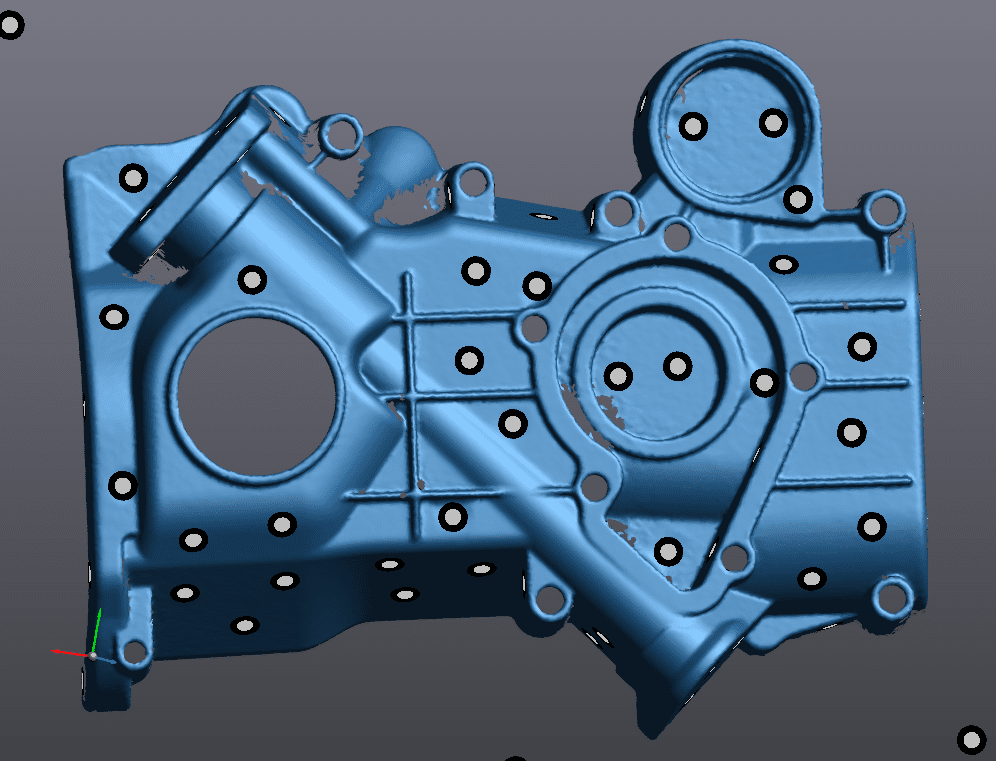
30 Sec Method 2
The 30-second scan using Method 2 performed better than the 30 second Method 1 scan. The difference between M1 and M2 is clearly shown below. The spiderweb pattern allows for the completion of a better scan because we were able to measure 7 of the 12 critical features.
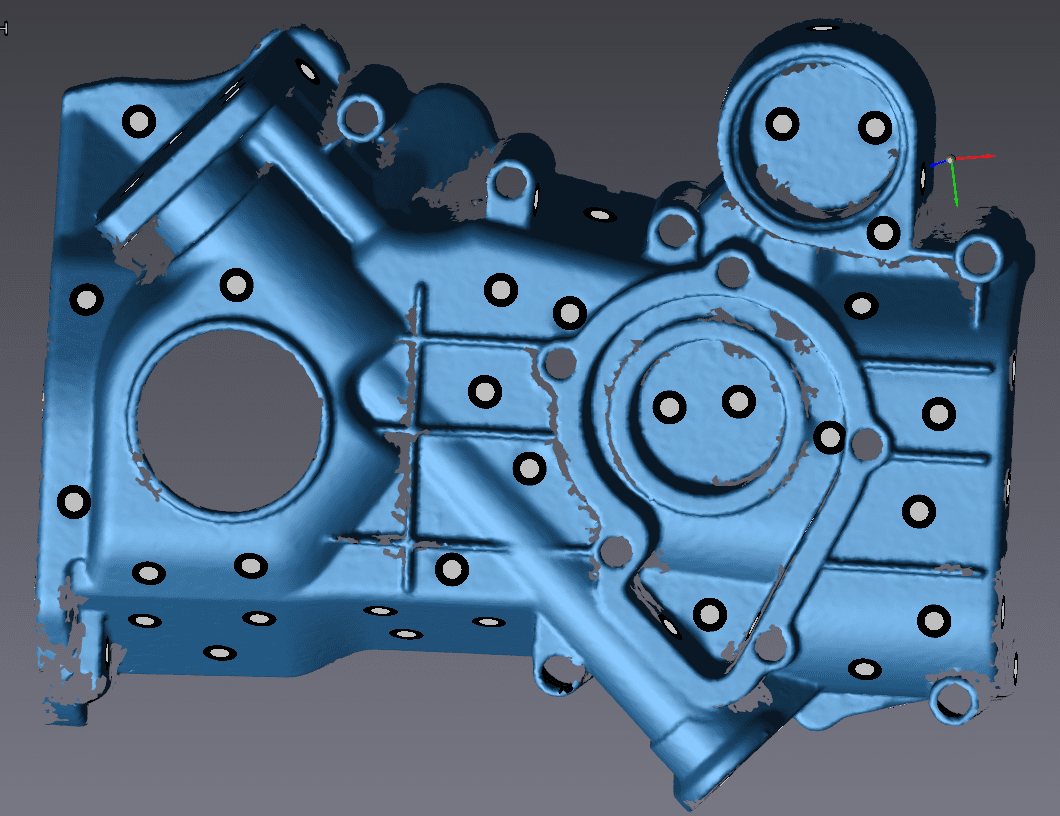
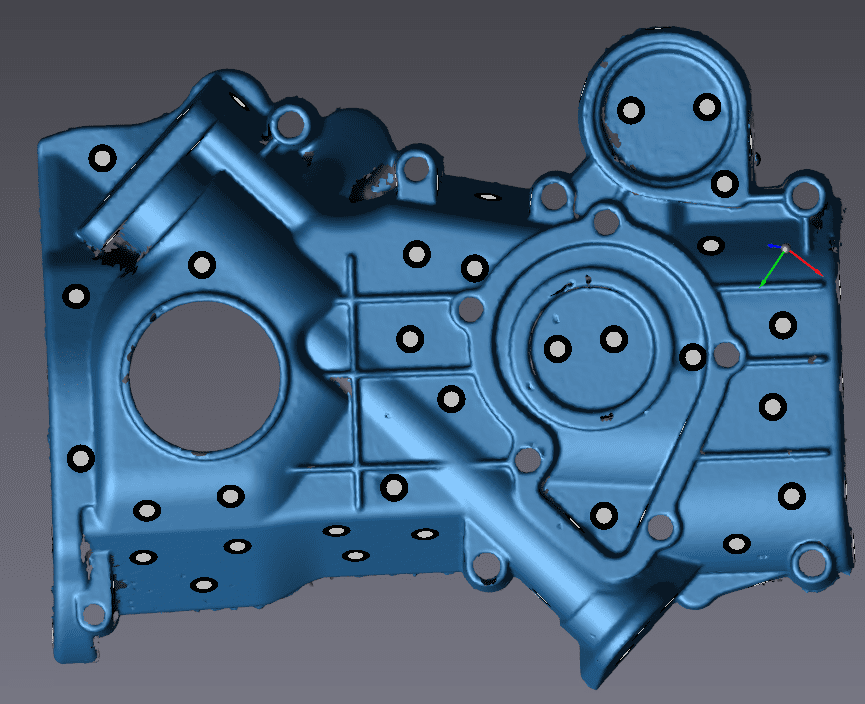
1 Min Method 1
When the scan time for Method 1 was extended to a minute, we were able to measure 7 of the 12 critical features.
1 Min Method 2
The image created using Method 2 is more complete than the image created by method 1. We were able to gather a lot more data from the upper left-hand side. In the end, we were able to measure 10 of the 12 critical features.
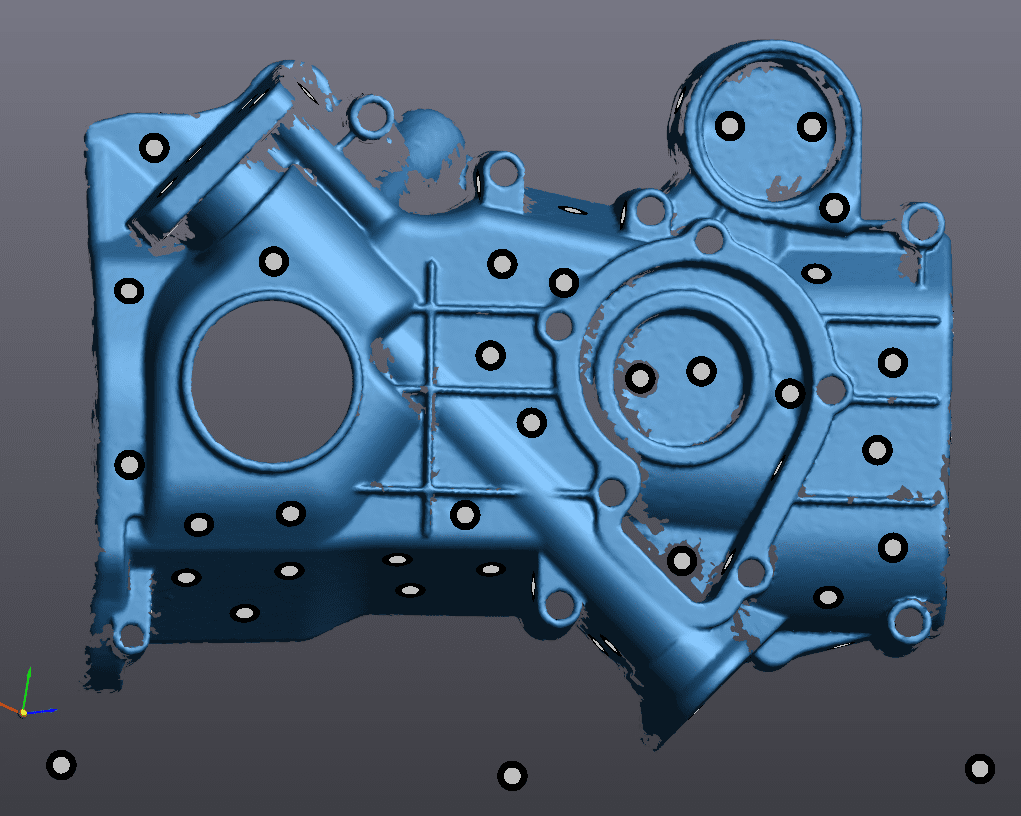
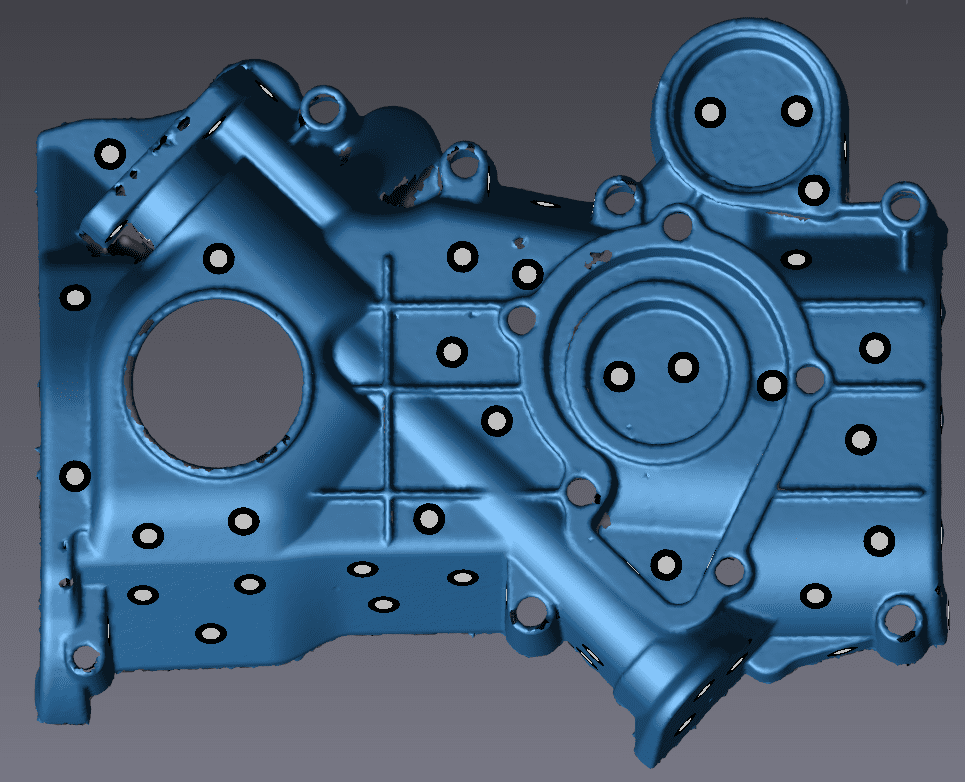
2.5 Min Method 1
Method 1 even at 2.5 minutes is not the best option. Surprisingly, even with a significant increase of scan time with method 1, it was just able to match the results of the 1-minute scan using method 2. We were able to measure 10 of the 12 critical features, but not enough to get the central cylinder.
2.5 Min Method 2
When the time was increased to 2.5 minutes using the Method 2 technique, we were able to create a complete top scan. We were able to measure 12 of the 12 critical features. Therefore, proper technique can gather a complete scan of your critical points, while also gathering as much surrounding data as possible.
5 Min Method 1
The longer you scan the more you can make up for non-ideal scanning technique. In a 5 minute scan, we have measured all 12 of the 12 key regions and captured a relatively complete scan as well.
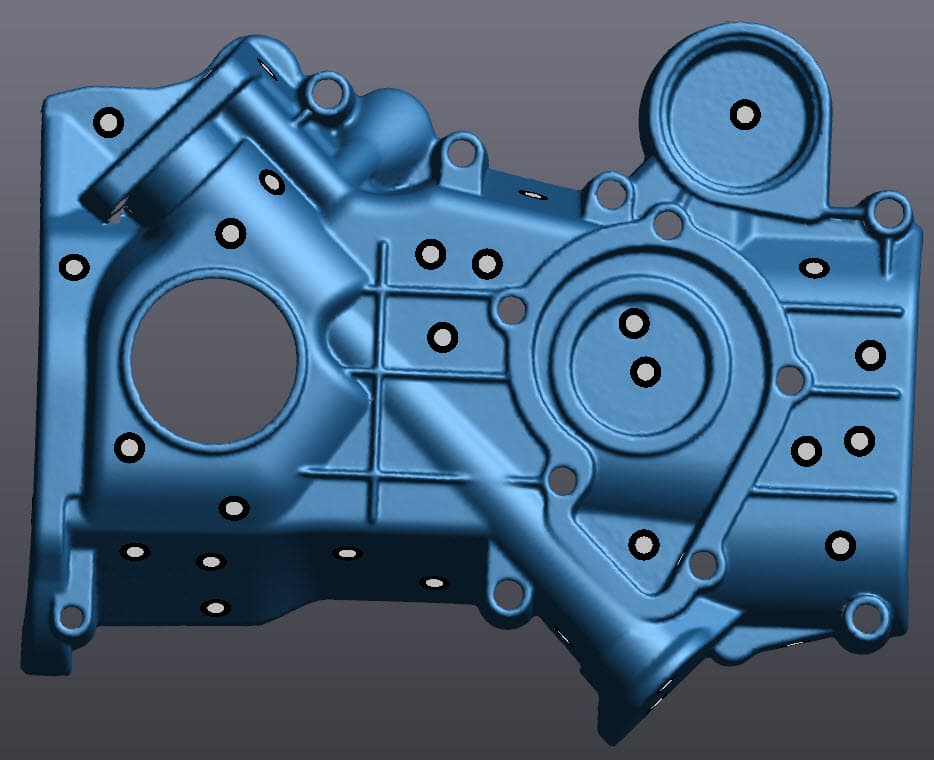
5 Min Method 2
Here we can see how proper technique and a slow and steady pace can create a great scan. All 12 measurements were successful.
Unsuccessful Measurements
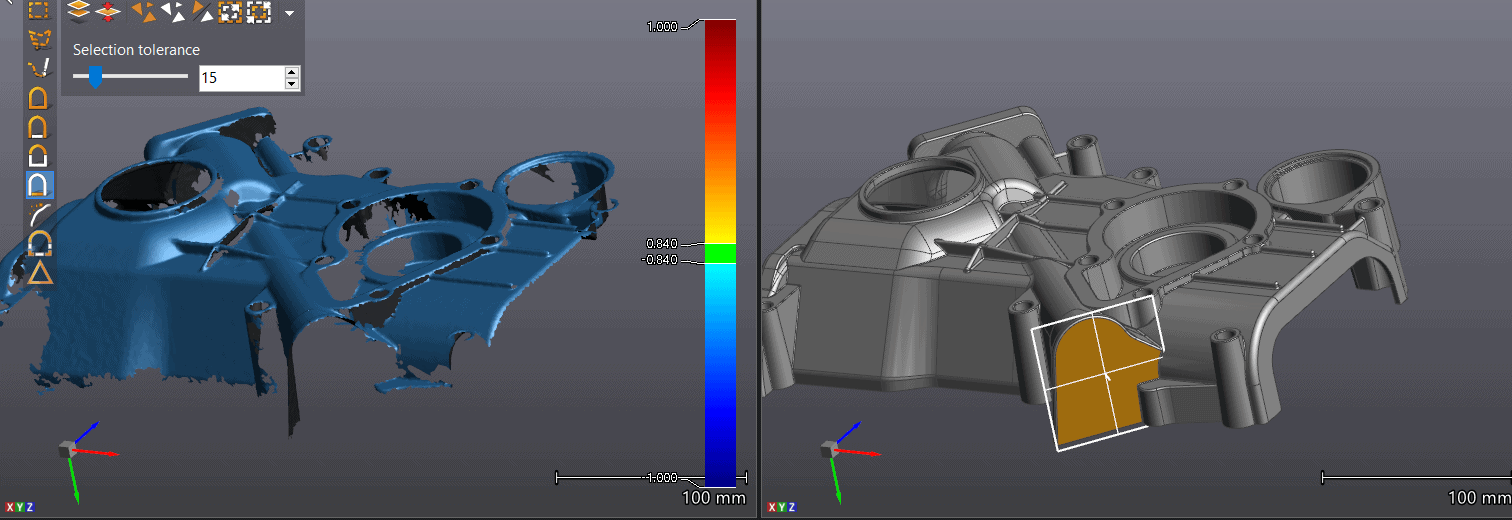
Below are some screen grabs that illustrate why some scans had less successful measurements than others.
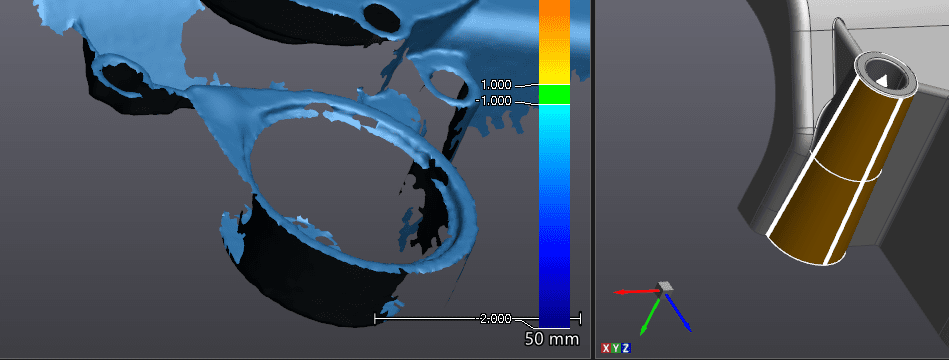
Here, the cones did not have enough surface area for the system to auto-detect the cone correctly.
Over here, we are missing a face which is critical for accurate measurements.
Now, we have an incomplete cone, but we can see that the system tried to snap a cone on it.
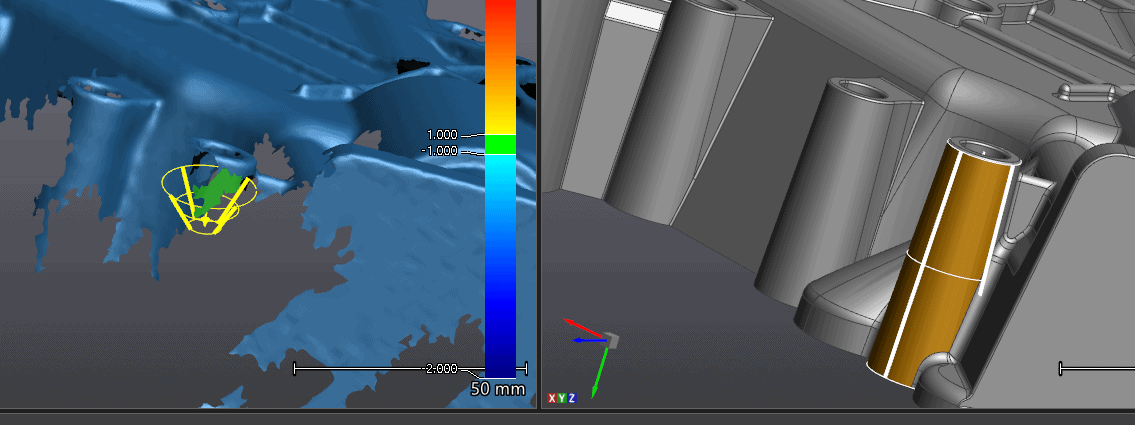
Below, the inner cone of this part is missing along with the side walls.
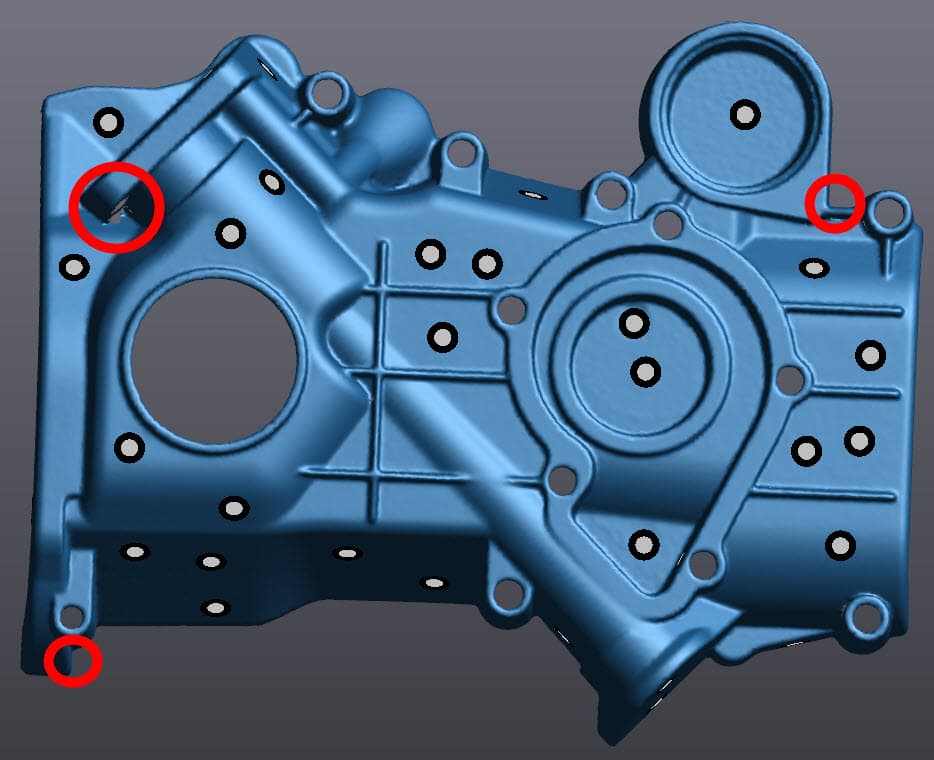
Bonus Round: 3min – 12/12 success near perfect scan.
Just to reiterate the point that proper technique, pacing and strategy can yield amazing results.
This method is similar to our Method 2 in this example, however, when using this method we localize the center over our central most key feature(s). Then, we concentrate the branches on the other key features which created a lot of overlap. We also pay attention to our pacing and distance to the part in order to optimize the data collection.
If you take a careful look at the scan below, you will see that it’s not perfect, there are 3 holes that were missed. Note that the holes are either in the far reaches of our bonus objective or in a tough to get edges.
Thank you,
Keith Weber
Application Engineer for Manufacturing Solutions
Computer Aided Technology, LLC