How do I view SOLIDWORKS Flow results and create my first cut plot?
How do I view SOLIDWORKS Flow Simulation Results and Create My First Cut Plot? SOLIDWORKS Flow Simulation is a computational fluid dynamics (CFD) analysis software. Flow Simulation provides an understanding of fluid motion around or through your design. For an understanding of how to create and solve a Flow Simulation study please see the accompanying blog “How do I create a Flow Simulation analysis project?”. Once your study is created and run the next step is to interrogate the results. This blog is intended to show how to load the Flow results and create your first cut plot.
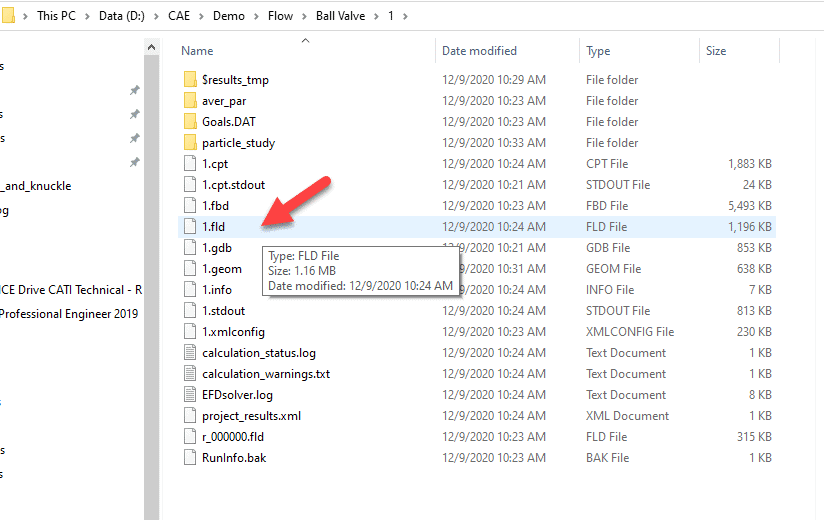
By default, SOLIDWORKS Flow Simulation will load the results after solving. If you unchecked this box in the Flow Solver or are opening an old Flow project, follow these steps to “load” your flow results. Note that the Flow results file is known as an .fld file. This file is located in a sub folder labeled for the number of the study run. For example, the first run of the study creates 1 sub folder and 1.fld file.
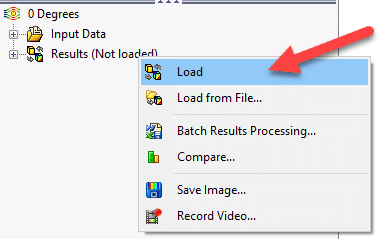
Once inside of Flow Simulation, click your right mouse button on the Results folder and you can “load from file” to specify a file if the .fld if the file was moved, or “load” to automatically select the .fld file associated with the study.
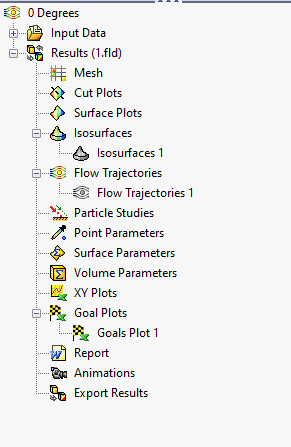
Once loaded the Results folder will have a #.fld file shown next to it in the Flow Simulation tree.
Once the results file is loaded you have a wide range of plots and results to interrogate. We will look at the cut plot in the second part of this blog. A cut plot is a plot based on a plane in the model that displays the engineering information of the fluid cavity. For example, a fluid Contour Plot of velocity.
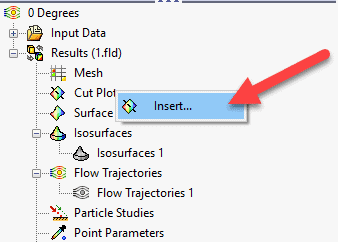
To add a cut plot right mouse button on the Cut Plots folder in the Flow Results tree. Choose “Insert” to start the Cut Plot property manager.
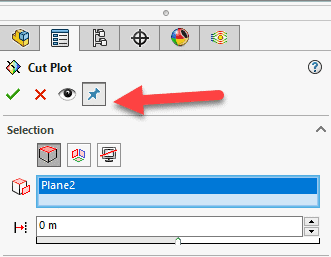
Like most property managers you can select a push pin to hold the property manager open.
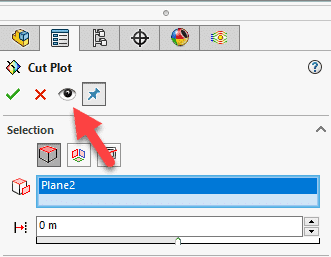
After making changes to the cut plot, choose the eyeball to display the change on the screen.
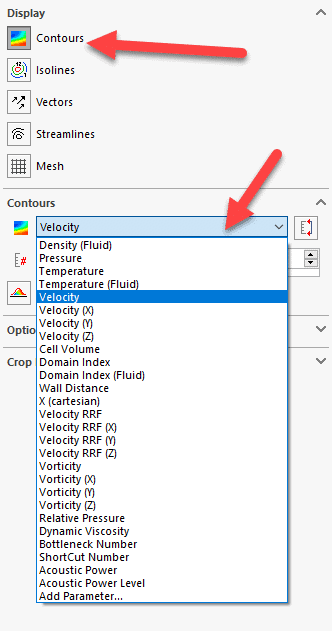
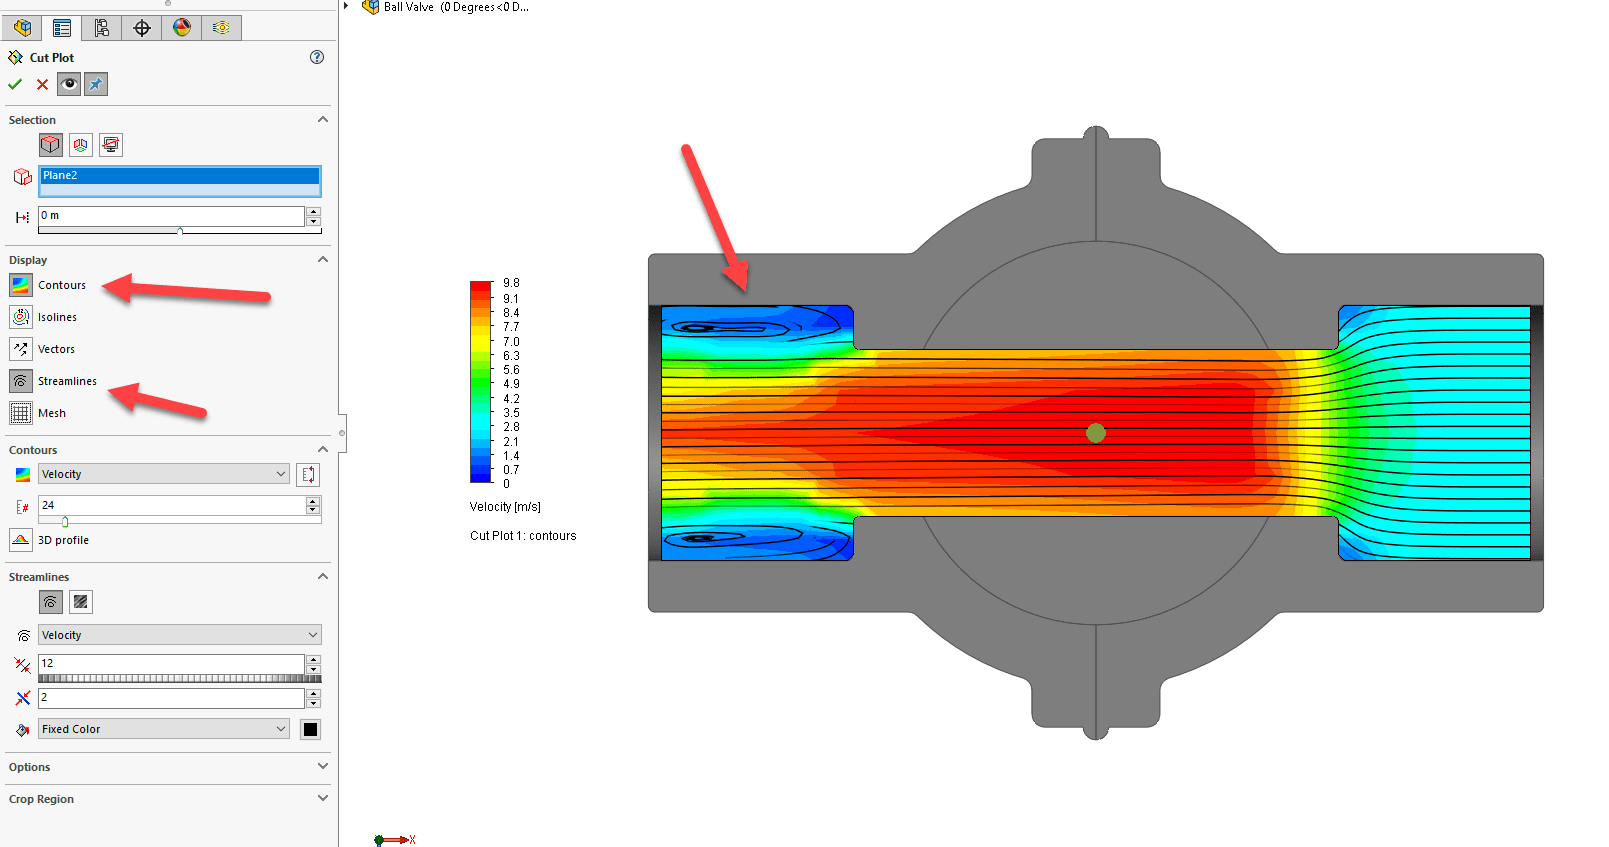
The cut plot offers a wide range of options for the display type. Contours, Isolines, Vectors, Streamlines, and Mesh. Contours is a popular choice showing a colorful gradient on the cut plane for outputs like velocity, pressure, vorticity etc. Below is the velocity contour output.
![]()
Multiple outputs can be combined as shown below. The velocity contour, and streamlines are overlayed.
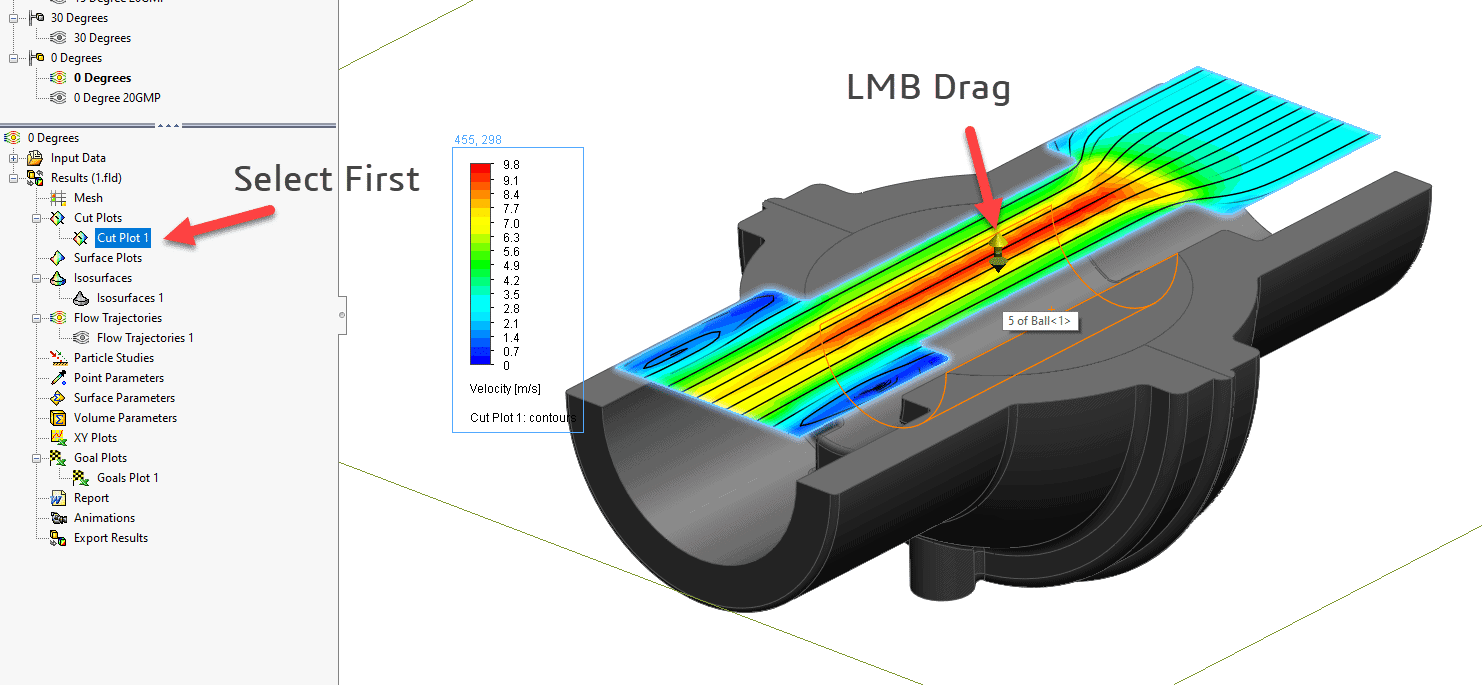
Once the cut plot is accepted and shown the plot can be repositioned by left mouse button selecting on the plot and choosing the gold grab handle.
Loading Flow Simulation results and generating your first cut plot is straight forward in SOLIDWORKS Flow Simulation. Try it out for yourself and customize the cut plot output to your specific preferences. There is no right or wrong way to create a cut plot.
This blog has an accompanying video under the same title. Check out the Computer Aided Technology video page for more information and subscribe.
Robert Warren
Simulation Specialist, Elite Application Engineer
Computer Aided Technology, Inc.