What Can I Learn in a Buckling Study?
Like most of the central United States, the Chicago area (where I live) experienced a brutal February 2021 with frigid temperatures and lots of snow. We got whacked with a serious blizzard that lasted about 36 hours. This was the scene outside my back door when the blizzard was over.
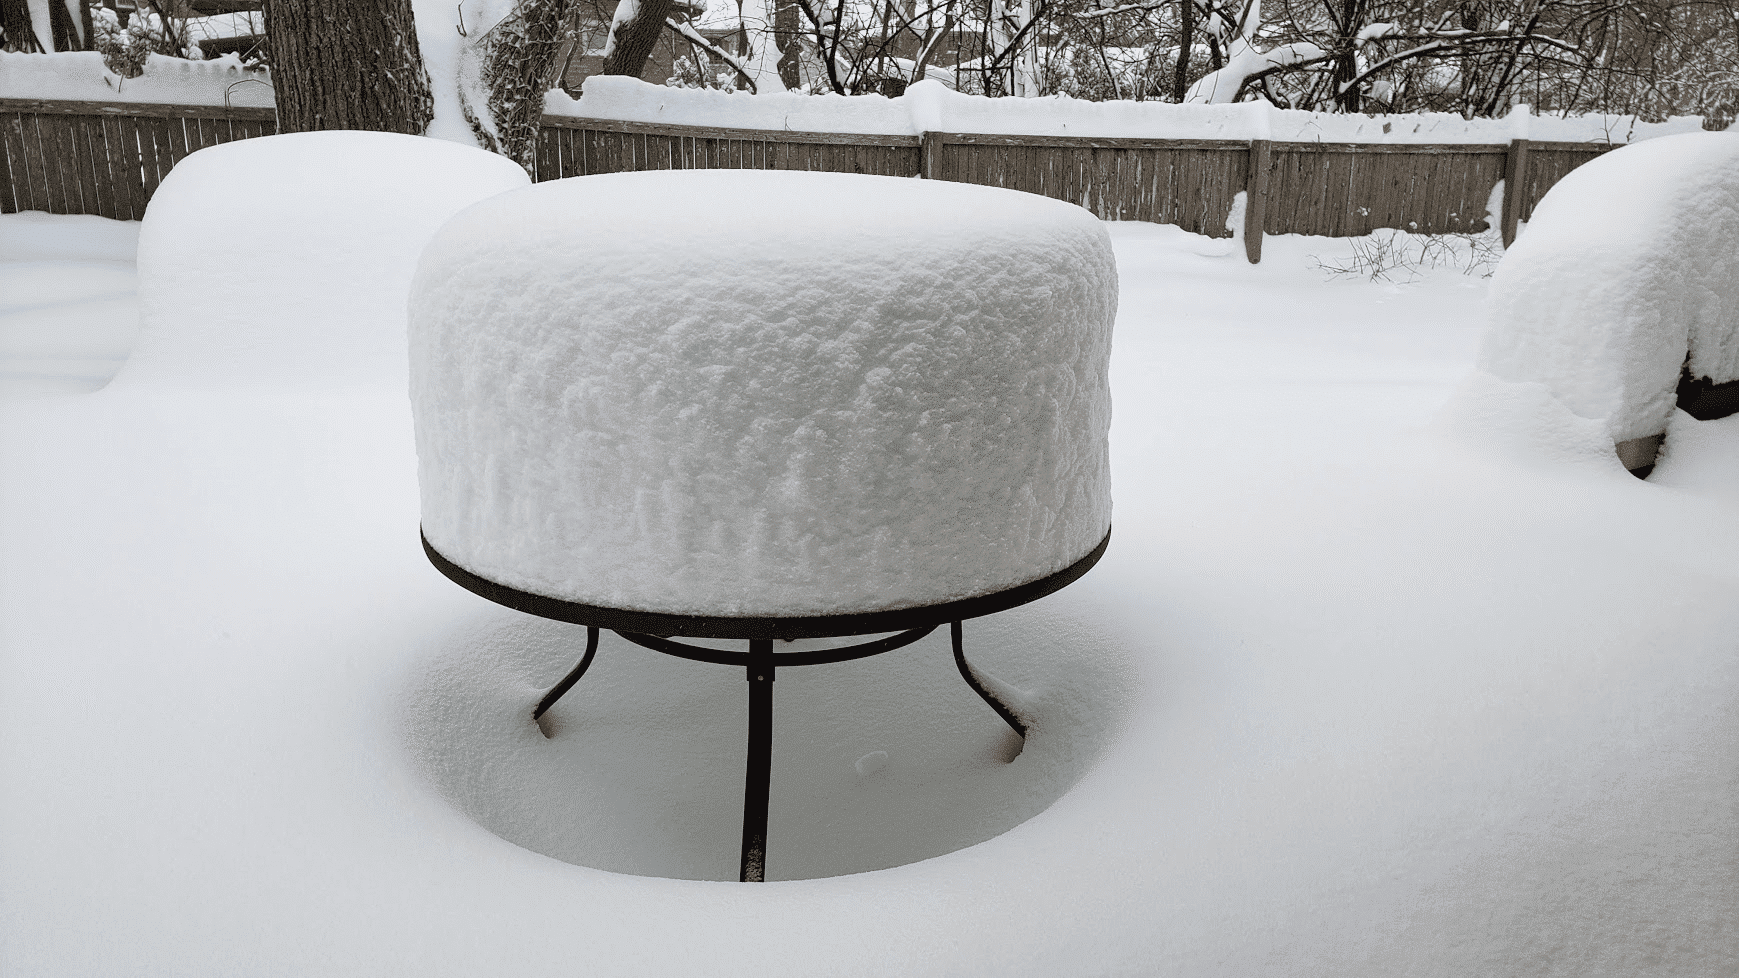
That’s 22 inches of fresh powder on my patio table. After the backbreaking work of shoveling the driveway was complete, I started to wonder whether my patio table was in any danger of collapsing under the weight of the snow. I decided to find out with the help of a buckling study in SOLIDWORKS Simulation.
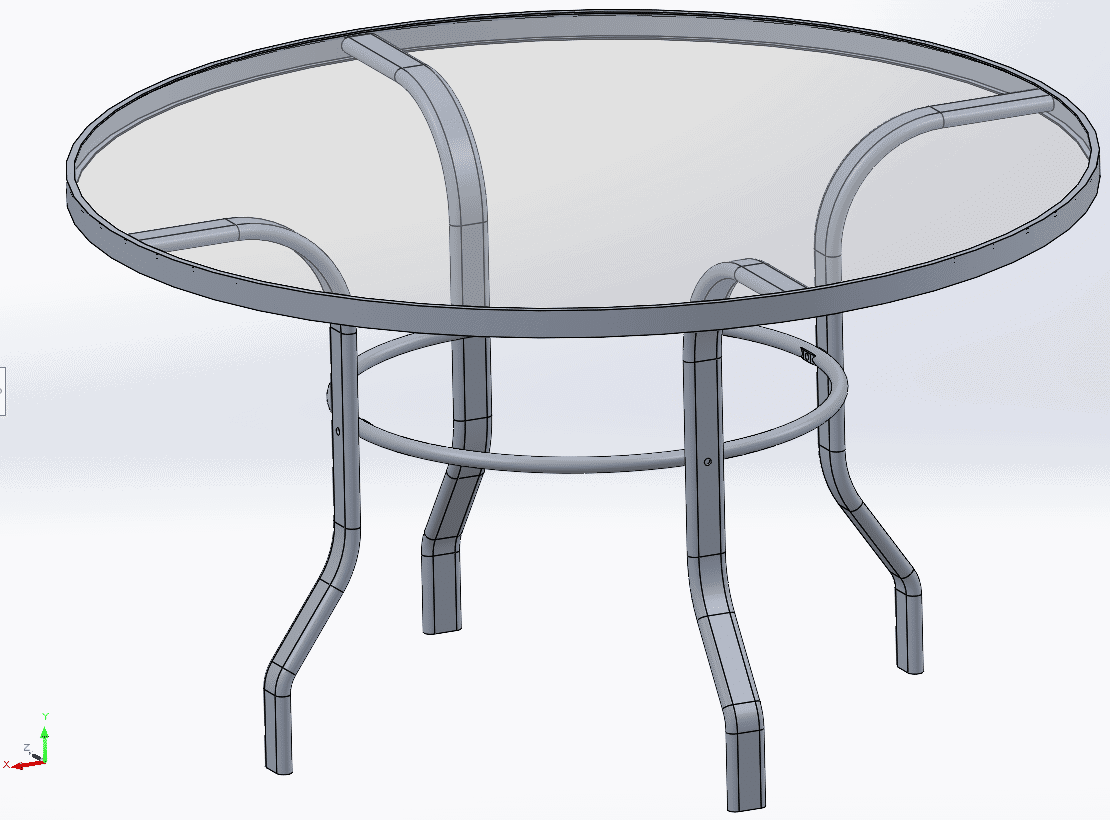
First, I created a simple model of my table with the help of SOLIDWORKS 3D CAD. I took a few basic measurements with a tape measure to get started. Not wanting to spend too much time outside in the single digit temperatures, I used estimates for some of the trickier dimensions (like the wall thickness of the table legs, which would have required a caliper and some frozen fingers to measure accurately)! I assumed the metal parts were all 6063-T6 Aluminum. The tabletop is glass.
Slender components that are subject to compressive loads are likely to fail in buckling. Before commencing a buckling study, the recommended workflow is to set up a linear static study first. The linear static study can help us trouble-shoot that the fixtures and loads are correct, and the assembly deforms and stresses in an expected way.
To apply the snow load I decided to use an evenly distributed pressure load. But how much pressure does 22” of snow exert? Turns out that is a tricky question to answer, since it is very dependent on the type of snow. As any Midwesterner knows, there is a big difference between light and fluffy and the thick, wet stuff. I found a useful online calculator that included a few different categories for snow type.
https://www.omnicalculator.com/construction/snow-load#what’s-the-weight-of-snow-on-a-roof
I chose a 1m x 1m area, in order to get pressure in N/m^2. The variation in load depending on snow type is shown in the table below.
| Snow type | Snow weight (kg/m^2) | Pressure load (N/m^2) |
| Fresh snow | 33.5 | 329 |
| Damp fresh snow | 61.5 | 603 |
| Settled snow | 139.7 | 1,370 |
| Wind packed snow | 209.6 | 2,055 |
| Very wet snow | 419 | 4,109 |
| Ice | 512 | 5,021 |
I chose wind packed snow (2,055 N/m^2) for my simulation.
To restrain the table, I created a “Roller/Slider” fixture on the base of each leg. This fixture prevents any movement perpendicular to the floor but allows the leg to slide in any direction in the plane of the floor. It is as if the legs are sitting on a frictionless sheet of ice (which they kind of are)! I also applied an “On cylindrical face” fixture to the rim of the glass support flange to prevent the table from rotating about its centerline axis or moving in a horizontal plane.
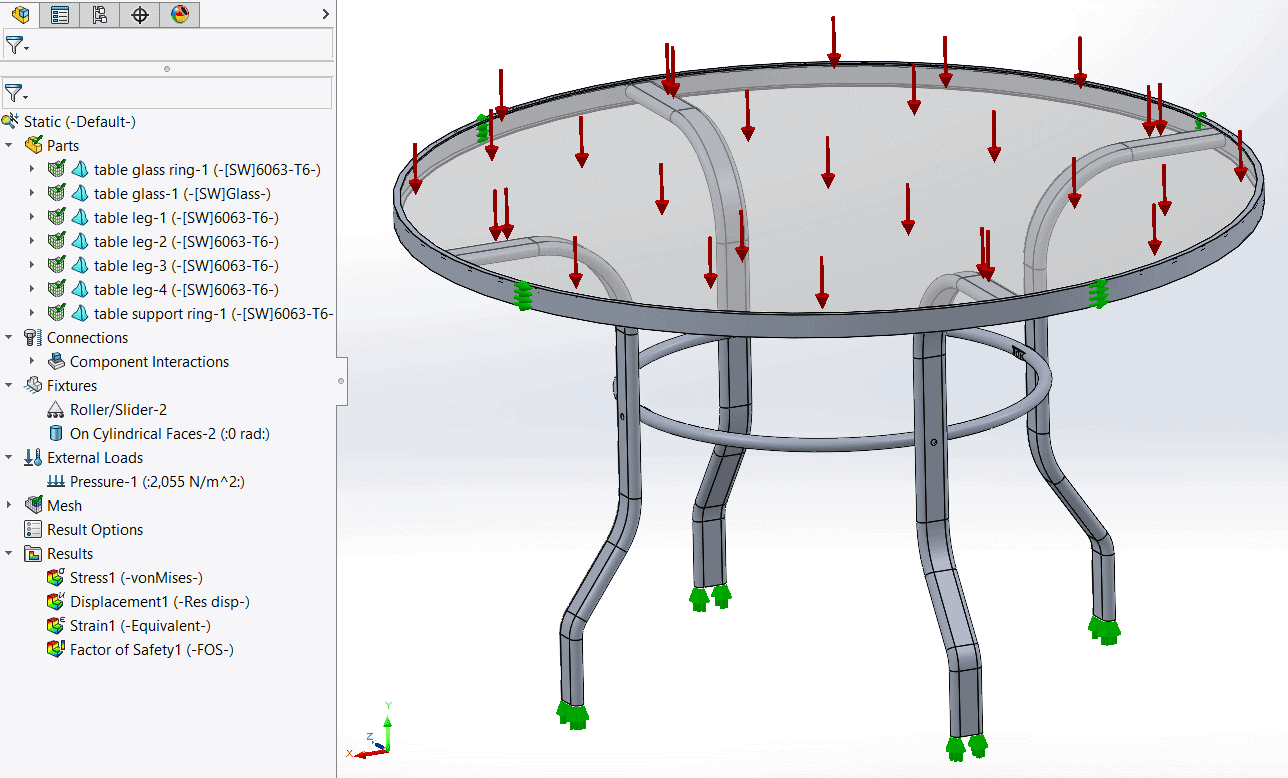
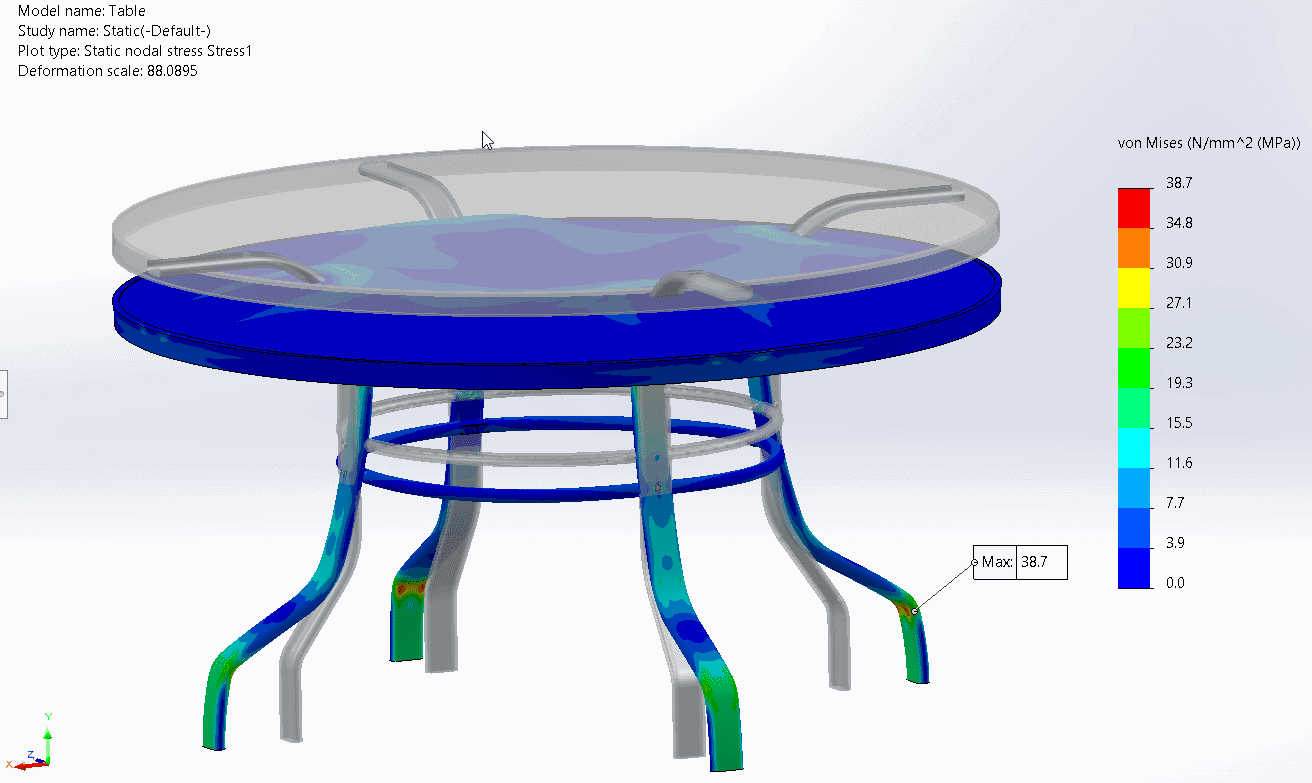
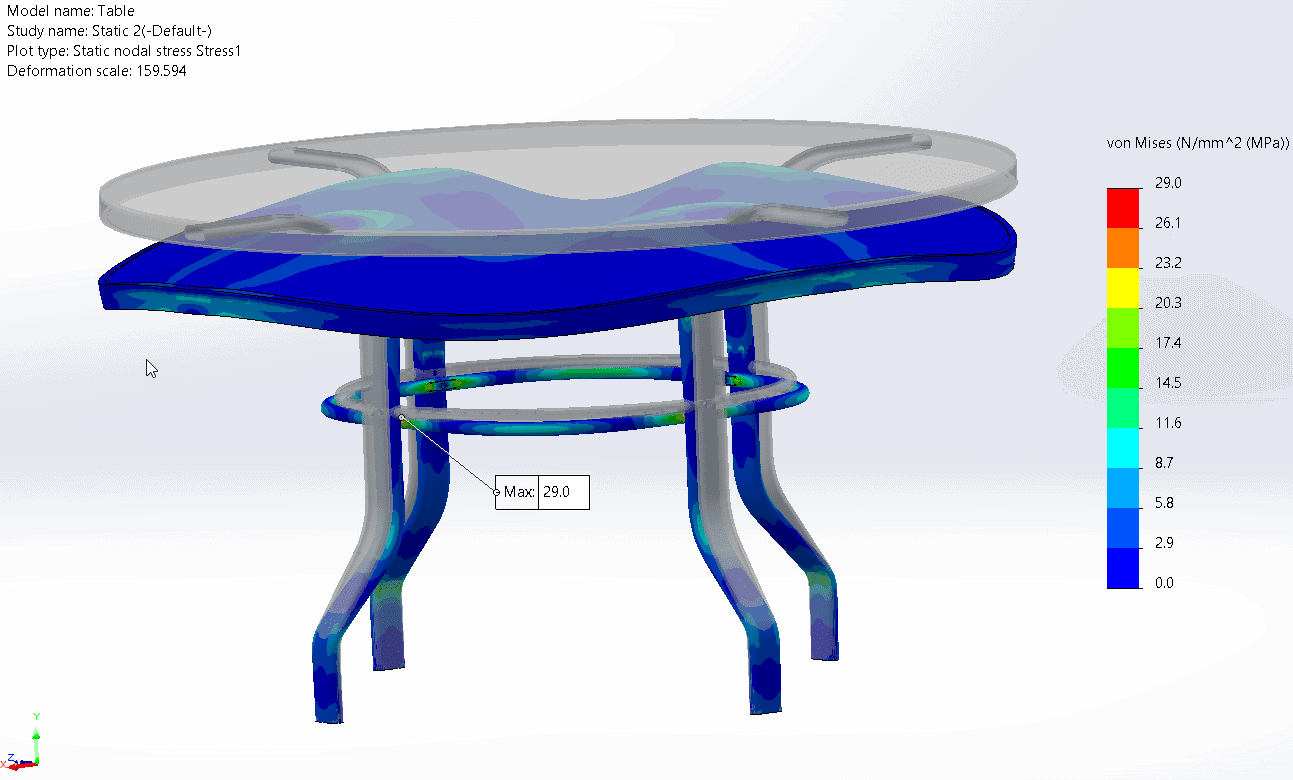
With my setup complete I ran the linear static study and observed the downwards deformation of the table, the splaying of the legs outwards and a maximum von Mises stress of 38.7 MPa on the inside of the lower bend in the legs. This maximum stress is caused by combined axial and bending compressive stresses. 6063-T6 Aluminum has a yield strength of 215 MPa, so my table has a safety factor on yield of 5.55.
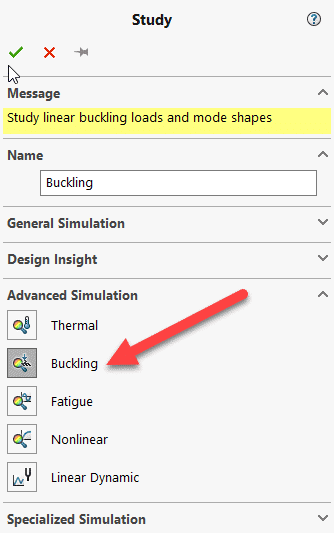
With the static study complete I created a new buckling study. Click “New study” and then select “Buckling” under the “Advanced Simulation” category.
To apply loads and fixtures we can just drag-and-drop these folders from the static study into the buckling study. This time-saving trick is part of the value of setting up the static study first.
We can also drag-and-drop the connections and mesh folders, provided we don’t have any contact interactions (i.e. all of our interactions need to be bonded or free). Contact interactions (formerly called no-penetration contacts) are not permitted in linear buckling studies because they would cause a change in the stiffness of the model. For a linear buckling study our stiffness matrix is only calculated once, so we can’t have variable stiffness caused by contact interactions.
With the setup complete we can run the buckling study and investigate the results. With most buckling studies there are only two results that are of interest to us.
The first result is the buckled mode shape, which will display automatically once the run is complete. This represents the shape the structure will take the instant that it buckles. Note that the magnitude of the deformation is meaningless; the only thing of meaning is the shape. In the case of the table, two of the opposing legs splay outwards. This elongates the supporting ring, which pulls the other two legs of the table inwards as shown below.
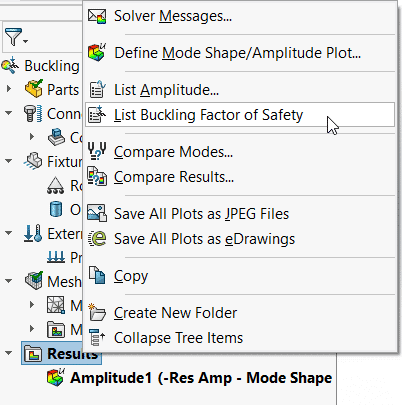
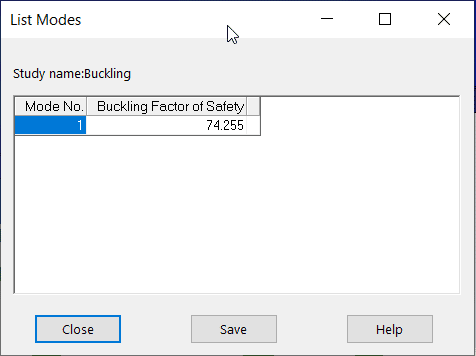
The other result that is of interest in a buckling study is the buckling factor of safety. To find this, right click on the results folder and then click “List Buckling Factor of Safety”.
In this case the buckling safety factor is 74.3 which is a lot higher than I expected. In other words, my pressure load could be increased by a factor of 74.3 before the table buckled.
It turns out that the legs of my table would fail under the combined axial and bending compressive stresses a lot sooner than the whole structure would buckle. Since my worst-case static study safety factor was 5.55, that would indicate my table could potentially handle 22” x 5.55 = 122 inches of snow. Hopefully, spring comes before that happens!
Lastly a note on the importance of correct fixturing. I ran additional static and buckling studies where I replaced the “Roller/Slider” fixture at the base of the legs with a “Fixed Geometry” fixture instead. For the alternative static study, the distribution of stresses looked completely different and the location of maximum stress moved from the lower bend of the table leg to the inside of the supporting hoop.
For the alternative buckling study, the shape also looked completely different and the buckling factor of safety was -37.1. The negative buckling load factor means that the applied load actually creates tension in the structure, which stiffens it and buckling won’t occur. The bottom of the legs are prevented from splaying outwards, which creates tension in the table top support flange.
In reality the base of the legs are neither fully fixed nor completely free to slide. There is friction between the legs and the floor, which allows some amount of outwards movement. We would have to apply some judgement and interpretation to the results or run a more sophisticated analysis that includes the friction with the floor for a more accurate result.
Now can someone please turn on the heat a little and end the pandemic, so I can actually enjoy a BBQ with my family and friends out on my back porch!
Alon Finkelstein
Simulation Product Specialist
Computer Aided Technology, Inc.