SOLIDWORKS Simulation: Draft Quality and High Quality Elements - Part 1
It’s all about the nodes and the equations! At least that’s what my office mate, Chris, says. I’m not going to disagree with him, rather I am going to show that he is correct. That statement arose while discussing meshing in SOLIDWORKS Simulation and getting reasonably accurate results with Finite Element Analysis. That leads to the simple question “can I achieve accurate results using a draft quality mesh”?
In SOLIDWORKS Simulation, the easiest method of differentiating between a draft quality or high quality solid element is to look at their shape and formulation. Solid elements are a tetrahedron, sometimes described as a triangular pyramid. A draft quality solid element is a first order tetrahedral element with nodes at the four corners. The edges of a draft quality element are straight lines and the faces are planar. When a draft quality element deforms, it maintains straight edges and flat faces. Each edge of the draft quality element is formulated by the equation of a line, y = Ax + B. High quality solid elements are second order tetrahedral elements and have six additional mid-side nodes. The edges of a high quality solid element can be curvilinear and the faces can be non-planar. Each edge of the high quality solid element can be formulated by the equation of a curve, y = Ax^2 + Bx + C. Undeformed and deformed draft and high quality elements are shown in Figure 1, which can be found in the SOLIDWORKS Simulation training manual. Finally, each node of both draft and high quality elements have three translational degrees of freedom.
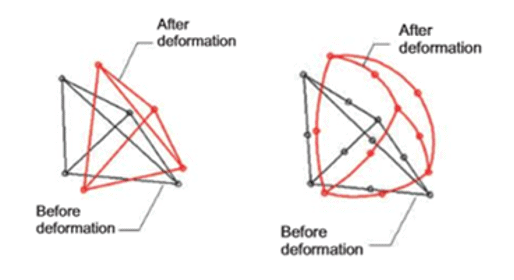
Figure 1
Now that I have described draft and high quality elements, I need to come up with a test to show differences in results between the two element formulations. To do this, I created a cuboid in SOLIDWORKS of size 1 mm x 1 mm x 2 mm. I then created a custom material with an Elastic Modulus of 100,000 MPa and a Poisson’s Ratio of 0.3. Then I created a SOLIDWORKS Simulation study with one end of the cuboid fixed, the other end having a combination of forces applied. The forces are 100 N in the +Y direction, 200 N in the +Z direction, and 300 N in the +X direction; see Figure 2. The loading conditions were chosen to show differences in displacement and stress while staying within the Linear Elastic range of the custom material.
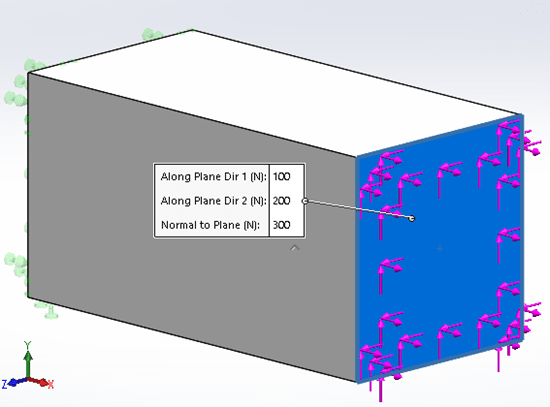
Figure 2
The key to my test relies on creating meshes with a similar number of nodes along any edge of the Finite Element Model. Using the Standard Meshing algorithm in SOLIDWORKS Simulation, if I mesh the study using high quality elements with a Global Mesh size of 1 mm, that mesh will have 1 element along each 1mm edge and two elements along each 2 mm edge of the SOLIDWORKS part model. Further, the 1 mm edges will have 3 nodes, while the 2 mm edges will have 5 nodes. See Figure 3.
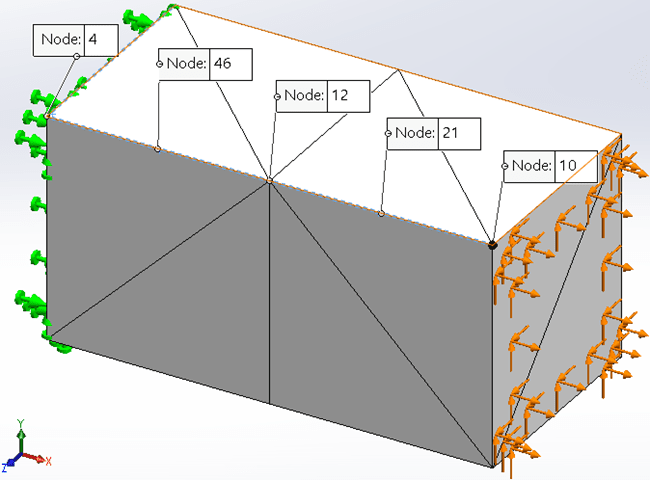
Figure 3
To generate a similar mesh with draft quality elements, the Global Mesh size must be set to 0.5 mm, which creates the same number of nodes along each edge. The next step is to set up a Design Study where the parameter to vary is the Global Mesh size. I will also create two SOLIDWORKS Simulation Data sensors, one to track maximum Von Mises stress, the other to track maximum resultant displacement. I will vary the Global Element size in the Design Study to generate results from 1 element along a 1 mm edge up to 15 elements along the same edge. Once the high quality meshed Design Study is complete, I will repeat the process generating a draft quality mesh with the same number of nodes along each edge. Figure 4 shows the table of Global Element sizes used for the two Design Studies.
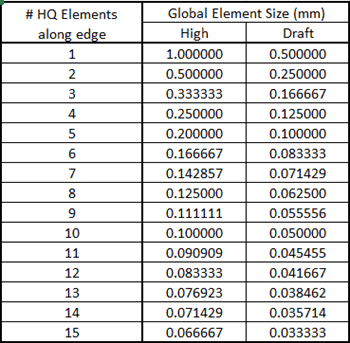
Figure 4
Reviewing the displacement and stress results from the two Design Studies, I can now start to answer the question I originally posed, “can I achieve accurate results with a draft quality mesh”. (See Figure 5) With high quality elements there is less than a 0.001 mm difference in resultant displacement when utilizing between 3 and 15 elements along a 1 mm edge. That equates to no more than 1.05% difference in resultant displacement. For comparison, if I start with a draft quality mesh with 6 elements along a 1 mm edge, equivalent to a 3 element high quality mesh to achieve the same number of nodes, I see comparable results. The maximum variation from 6 to 15 draft quality elements is 0.0015 mm, or 1.65%. While there is a slight lag in the data comparing draft to high quality elements, the trend appears to require almost twice as many draft quality elements to reach the same displacement accuracy of high quality elements. The difference in results between 3 high quality elements and 4 draft quality elements is 0.0029 mm, or 3.1%, based upon this Finite Element Model. This would indicate that the real multiplier is less than twice the number of draft quality elements for reasonable accuracy.
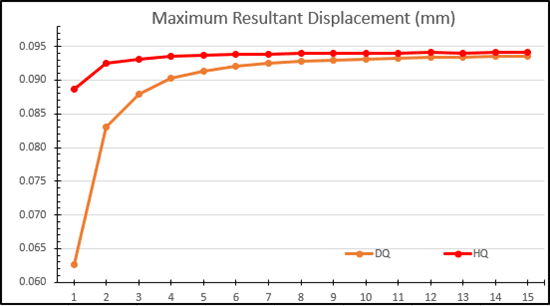
Figure 5
(See Figure 6) Comparing Von Mises stress results between the two design studies is slightly more complicated as there is a definite difference between draft and high quality results. Looking at the data point for 3 high quality elements, the maximum Von Mises stress is approximately 3500 MPa. If I track horizontally (towards the right, increasing number of elements along an edge) on the chart from this datapoint) I need to have 5 draft quality elements to achieve the same stress result. Similarly, if I look at the ninth or tenth high quality data points, to achieve similar stress magnitudes requires 15 draft quality elements. For this Finite Element Model, I cannot compare percent differences between the number of elements along an edge as I did when reviewing displacement results; the stress results do not converge due to a stress concentration at the fixed end. I could verify this using the SOLIDWORKS Simulation Stress Hot Spot diagnostics tool.

Figure 6
What I can quickly compare, however, are the meshing and solve times for the 15-element draft quality and 10-element high quality studies. The 15-element draft quality study takes 4 seconds to mesh and 8 seconds to solve (Figure 7).
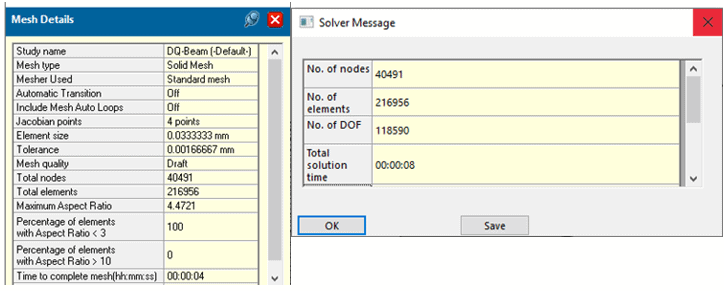
Figure 7
Similarly, the 10-element high quality Finite Element Model takes 1 second to mesh and 3 seconds to solve (Figure 8). Would the meshing and solution times alone lead me to use high quality elements over draft quality elements for similar accuracy? For now, I will only say the answer is a strong ‘maybe’.
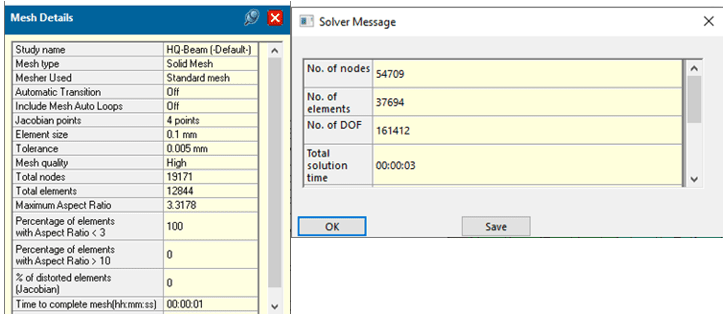
Figure 8
So far, I have only shown that it takes more draft quality elements to achieve similar results to what is calculated using high quality elements. When reviewing displacement results, based upon this Finite Element Model, it appears that between 1.5x and 2x more draft quality elements are required to generate similar displacement results. For Von Mises stress results, the trend is 1.5x more draft quality elements required for the same stress magnitude calculated with high quality elements. Due to the stress concentration and non-converging stress results, I haven’t fully answered the originally posed question. I will follow up this Part 1 blog with Part 2 where I continue to investigate draft quality and high quality elements on a Finite Element Model with converging stress results. Until then, go make your products better with SOLIDWORKS Simulation!

Bill Reuss
Product Specialist, Simulation
Computer Aided Technology, LLC