How Do I Create Custom Plots Utilizing Results Equations in SOLIDWORKS Simulation?
SOLIDWORKS Simulation has a plethora of default plots available, but inevitably there are times when I receive questions from customers on why SOLIDWORKS Simulation does not have a specific plot available. In today’s blog, I will show you how you can create additional plots using the Results Equations Plot feature in SOLIDWORKS Simulation.
Creating the Results Equation Plot
To access the results equation plot, you need to first set up your finite element study and run it. Once the analysis completes you can create this plot. Note the results equation plot is only available in Linear Static, Nonlinear Static, Nonlinear Dynamic, Linear Dynamic, Thermal, Drop Test, Submodeling, and Pressure Vessel Studies. The first step to do this is to right click on your results folder, and select the results equation plot, as shown below in Figure 1.
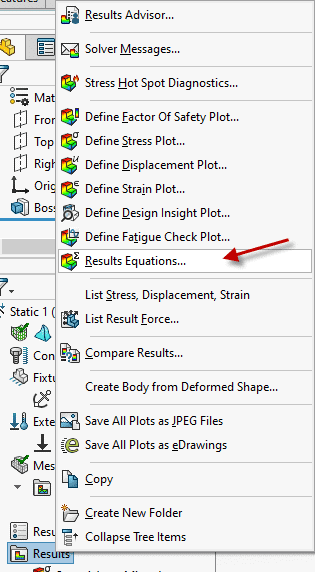
Figure 1: Results Equations Location
Once you click on the results equation plot, it will give you the option to select either nodal values or element values (Figure 2). We will be selecting element values because we are going to create a strain plot. In our case we are going to create a plot for Maximum Shear Strain. This is a plot that is not built into the default elemental strain plots that are available in SOLIDWORKS Simulation, and therefore a great example for the Results Equation Plot.
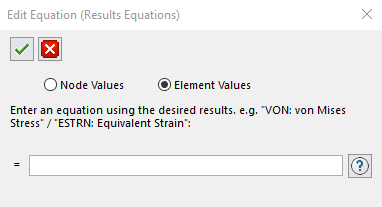
Figure 2: Results Equations Edit Equation Box
The other neat feature of the results equations plot is it can utilize mathematical functions in addition to the preset plots in SOLIDWORKS Simulation to generate custom equations. This is particularly useful because Maximum Shear Strain utilizes both mathematical functions and strain plot values to define Maximum Shear Strain. In Figure 3, we can see how we can apply the square root, as well as the normal and shear strain plots to key in the equation we need for Maximum Shear Strain.
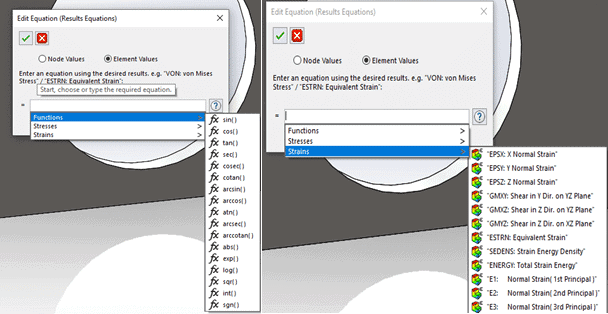
Figure 3: Results Equations Mathematical Functions and Plots
In our example, we want to key in the equation for the Maximum Shear Strain plot. After keying in the equation, we hit the green check mark on the edit equation plot to complete the custom equation plot. The equation we are utilizing in this example is shown in Figure 4.
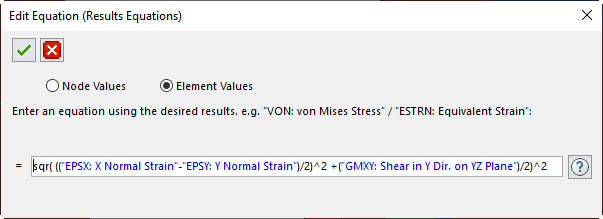
Figure 4: Custom Equation Value1
Postprocessing the Results Equation Plot
In our case we have now created the custom equation plot for Maximum Shear Strain, we can now post process our Maximum Shear Strain plot. The same postprocessing features that are available in the preset SOLIDWORKS Simulation Plots can be done on the custom Results Equations plots. We can change the title of our legend, probe, iso-clip, section-clip, etc. like we would with a SOLIDWORKS Simulation Default Plot. We can also adjust the scale of our Maximum Shear Strain Plot to show the results more clearly (Figure 5).
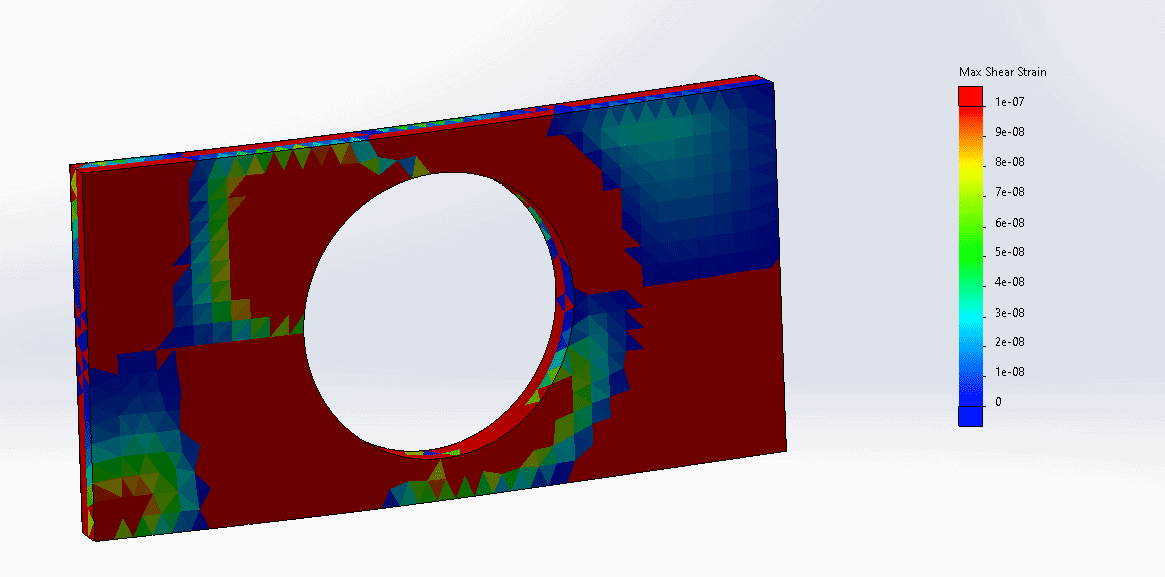
Figure 5: Custom Equation Plot Result
I hope with these tips, you will be able to create custom plots for future simulation scenarios! If you have any further questions about SOLIDWORKS Simulation, please reach out to us to see how you can utilize simulation to streamline your design processes.
- Note Equation for Maximum Shear Strain taken from: https://amesweb.info/StressStrainTransformations/PlaneStrainPrincipalStrains/PlaneStrainPrincipalStrains.aspx
Drew Buchanan
Application Engineer, Simulation Specialist
Computer Aided Technology, Inc.