SOLIDWORKS 2013: Image Quality and Assembly Visualization
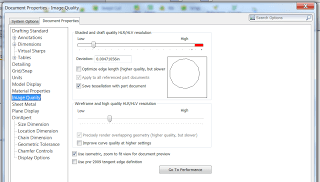
Many of us may not be aware of how SolidWorks displays the models that you see in the graphics area. We are all aware of the “Image Quality” slider that exists in the Document Properties tab, but here is some insight.
When you sketch a circle and extrude a cylinder, SolidWorks calculates a perfect cylinder. It then hands that information to the graphics card, which breaks up the faces into a series of triangles and then it “paints” over the triangles, so you never see the output of the SolidWorks kernel, you only see the output of the graphics card. If you manipulate the Image Quality slider, you are instructing the graphics card to use more triangles to make smoother edges. Sounds great, right? The more triangles, the more time required to calculate, and potentially, the more time you wait.
The triangles that the graphics card calculates are referred to as “tessellated data” and are stored in the file. The more graphics data you store in the file, the larger it is, and in turn, the longer it takes to open and save the document. As a simple test, create a small part and save it, noting the file size. Then crank up the image quality, rebuild and save it again. You should note a jump in file size due to the extra tessellated data. The tessellated data is stored in the document so that eDrawings can display the model. eDrawings isn’t using any real geometry; it is just accessing the tessellated data in the file.
Until SolidWorks 2013, we had no real way of knowing how many triangles/tessellations were actually in our part file. The “Assembly Visualization” tool has been enhanced for 2013, however, and will now report the number of triangles in a part. This gives us a real understanding of how our level of image quality affects performance. To access “Assembly Visualization,” go to the “Evaluate” tab of the Command Manager. Once the tool is on, you will have to add the Graphics Triangles column, as it is not a default. In the picture below, you will have to click on “More” and add Graphics Triangles.
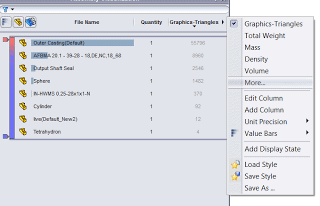
The above results are for the assembly you see below, and the parts are assembled in order of complexity.
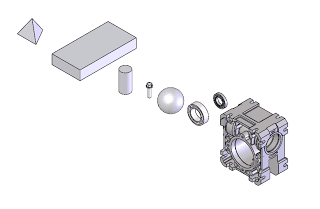
I chose the tetrahedron as the first shape because, using planar faces only, it has the least possible amount of sides (4) and subsequently, the least amount of faces/triangle. Going to the other extreme, it is easy to see why the complex casting has so many triangles; it has a high number of curved faces, and most of those are small fillets compared to the surrounding geometry. Interestingly, the ball bearing in the middle has a high number of faces. Why? It has all the balls modeled as spheres and you can see how many triangles it takes to make one sphere.
The real takeaway from this falls into two categories: First, watch the level and detail you put into a part and make sure that it makes sense to have that detail. Purchased or off-the-part-shelf parts should be as simple as possible to aid in performance. Second, watch the Image Quality you are using in the parts; it will affect the number of triangles, and subsequently the performance, in both rebuild time and save/open time. And again, as a simple experiment, create an assembly and check the number of triangles, then crank the image quality high up and recheck the numbers. You may be surprised!
For more training and tutorials on the many 3D CAD Modeling solutions in the SolidWorks family of products and add-ons, register for an upcoming Event or look into our SOLIDWORKS training.