Result Comparison Tools in SOLIDWORKS Simulation and Flow Simulation
Do you need an easy way to compare results when running multiple studies in SOLIDWORKS Simulation or multiple projects in SOLIDWORKS Flow Simulation? Both programs have great functionality for this. I’ll show you how to access each in this Simulation blog.
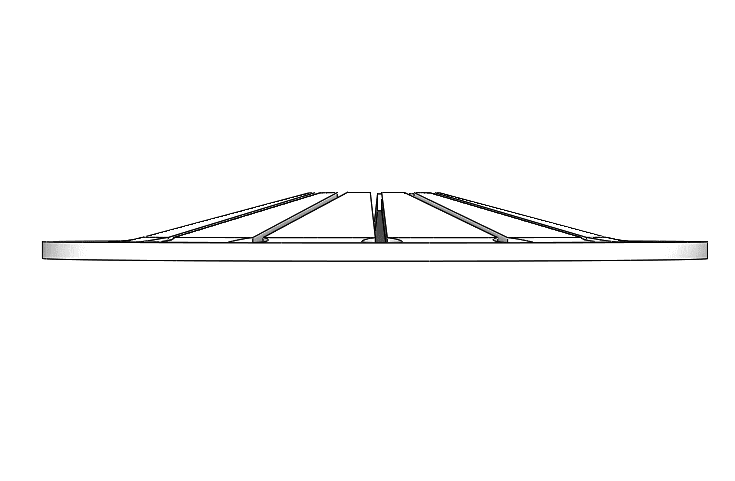
Let’s look at SOLIDWORKS Simulation first. Introduced in the 2014 release, the “Compare Results” tool allows a side-by-side look at up to four result plots associated with different configurations of the same model. The disk spring shown below is made of A316 stainless steel with a yield strength of 25 ksi. Two thicknesses of 0.100 in. and 0.125 in. are considered for supporting a 175-lb load with maximum deflection less than 0.1 in.
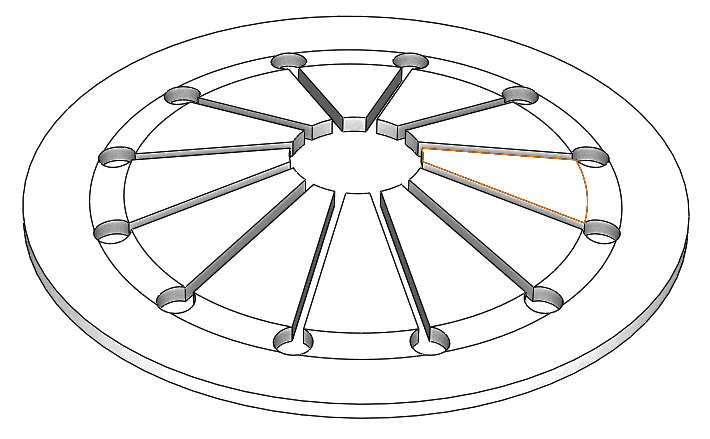
A disk spring made of A316 stainless steel with a yield strength of 25 ksi.
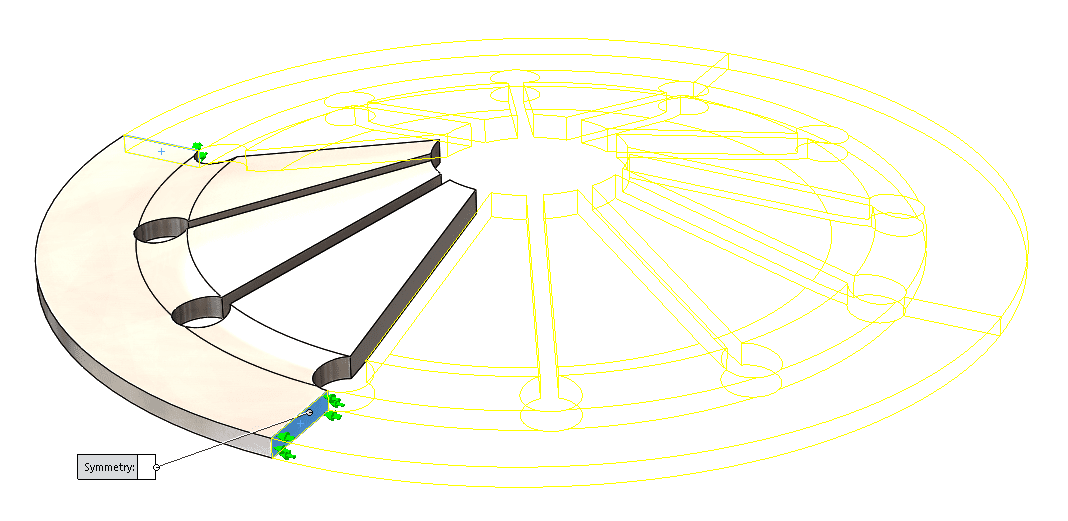
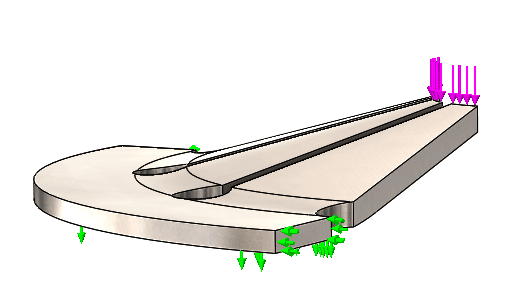
Studies for each configuration were set up using nonlinear material properties to account for any plastic deformation. Quarter symmetry was used to reduce the problem solution time. The load was applied to the inside, top edges in the downward vertical direction.
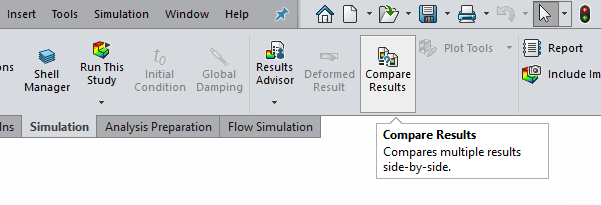
After running each study, we access the Compare Results tool from the Simulation command manager.
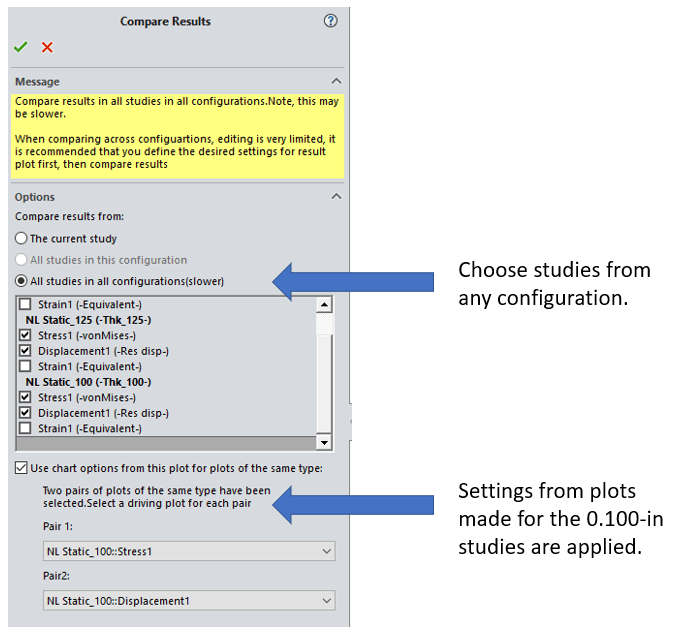
It is possible to compare the plots from the same or different configurations. We want to see stress and displacement results from the solution of the two thicknesses.
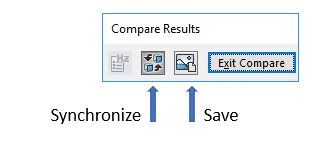
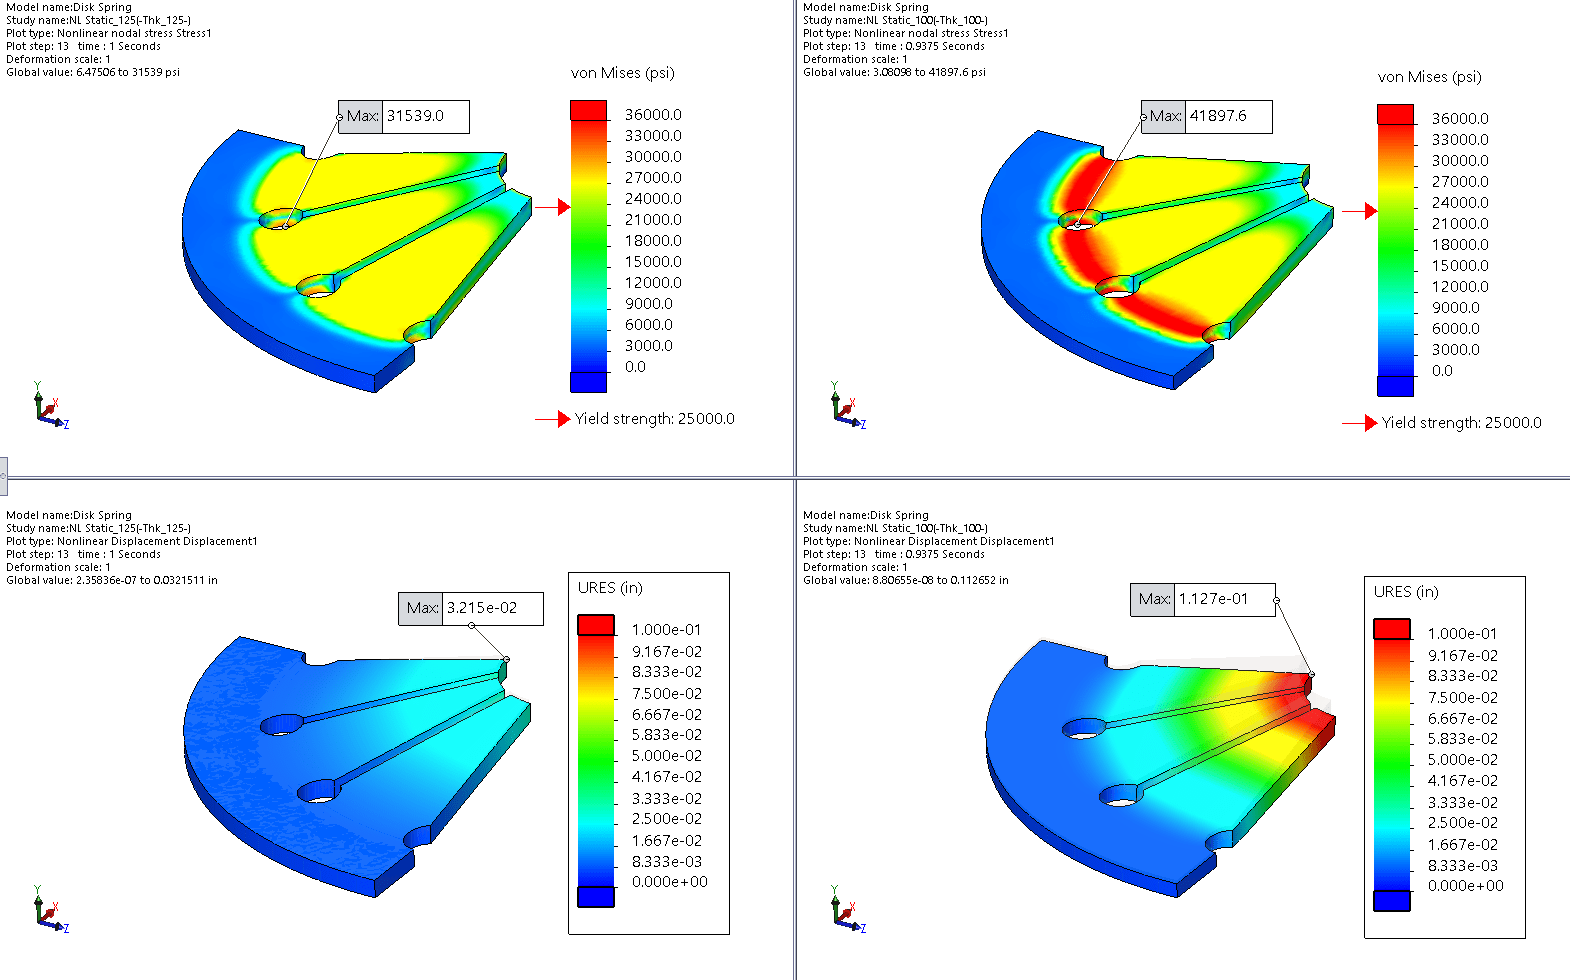
The Compare results are shown below using the same scale for each plot type (0.125-in on the left side). The 0.125-in thick spring will deflect an acceptable distance. Both springs show maximum stress greater than the yield strength of the material, suggesting that there will be some permanent deformation of the disk when the load is released. The small control window allows synchronization of the plots and saving the collection to a single image.
Now, on to SOLIDWORKS Flow Simulation. The analogous function in this program was introduced in the 2013 release and is very easy to use. I’ll show it using the following assembly. The power supply below requires comparison of results for two configurations of the heat sink part. For clarity, the top of the enclosure is hidden. The project is solved as an internal analysis with forced cooling provided by the inlet fan, with the appropriate materials and heat sources applied.
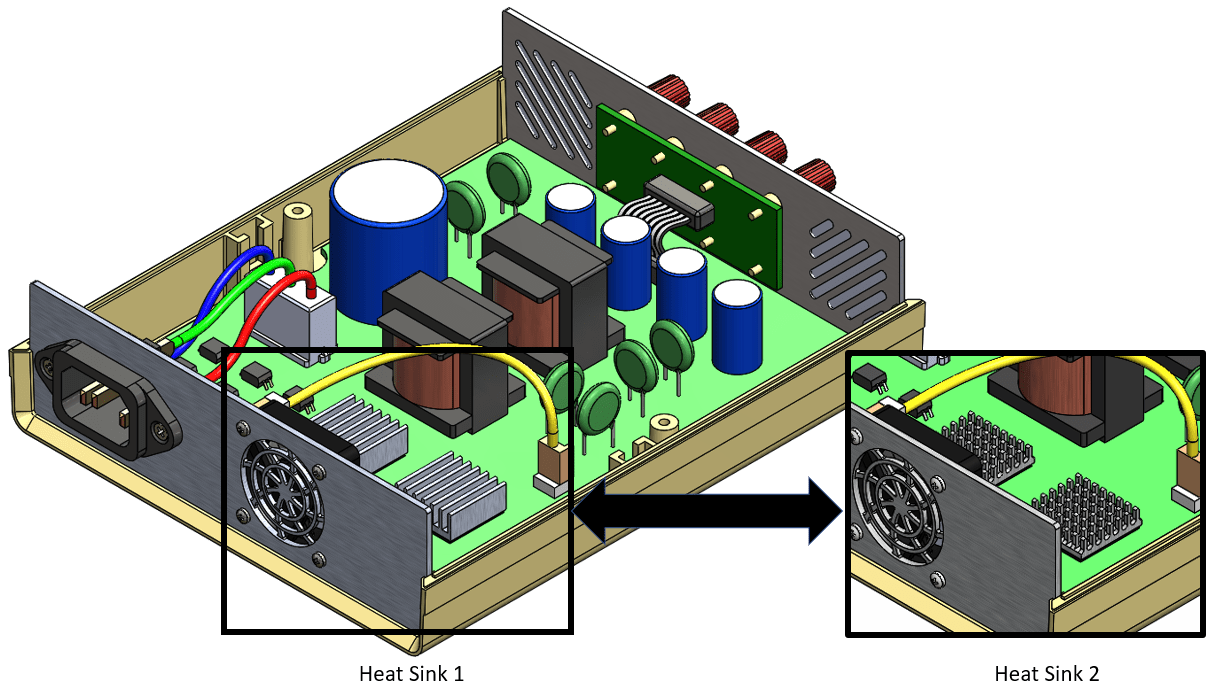
Two versions of heat sinks in a power supply. For clarity, the top of the enclosure is hidden in this example.
After solving both projects, we can set up a suitable result plot. I’ve done so below with a cut plot for the first configuration, which shows a maximum temperature of 115 deg. C around the heat sink.
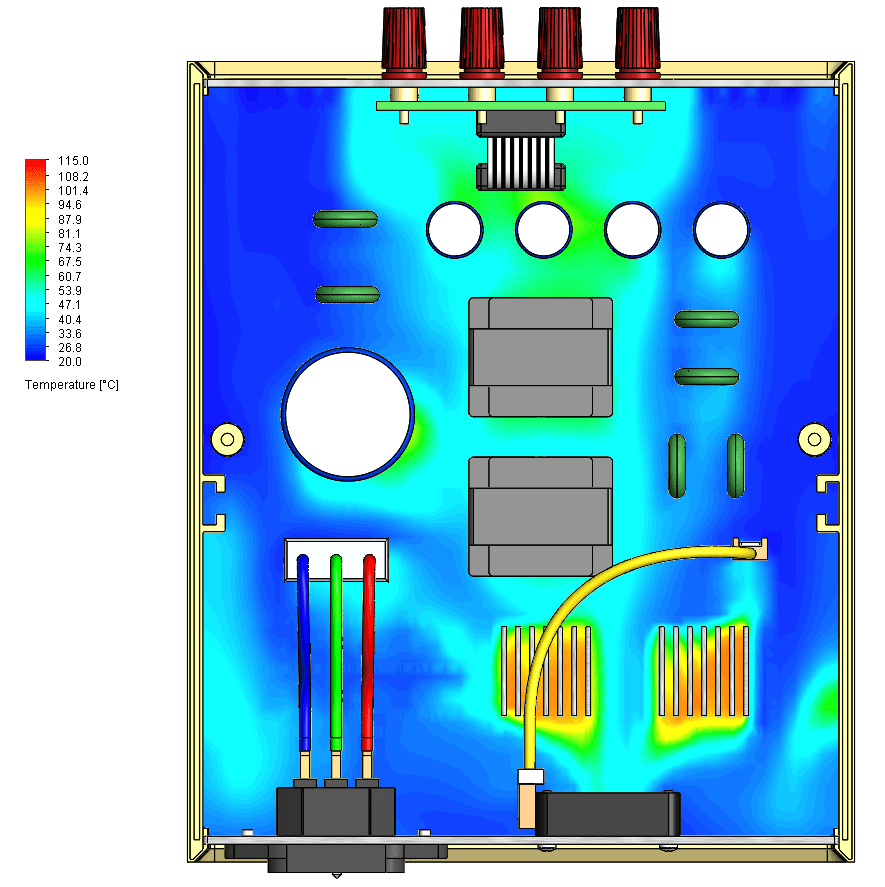
Solved result of Heat Sink 1 from previous image.
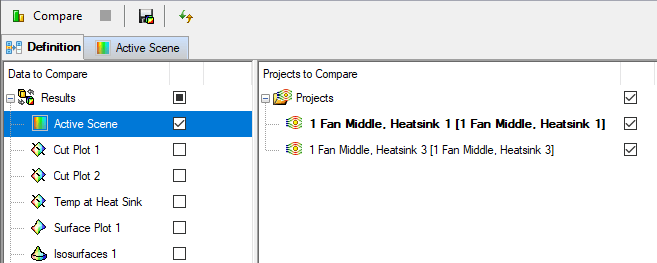
To access the Compare tool in Flow Simulation, simply right-click on the Results section of the project tree and pick it from the menu. It allows comparison of any plots that were previously created. Also, as highlighted below, I can compare the currently Active Scene (the plot shown above) for the two projects, applying the settings of the plot and model view orientation to both.
The comparison appears as side-by-side images under the Active Scene tab. We can open, save or copy them individually via right-click menu selections.
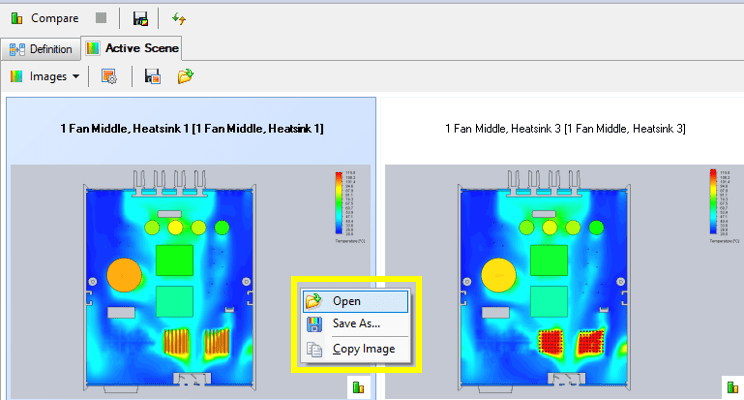
The left image in the view is Heat Sink 1, and the right image is Heat Sink 2 from the example assembly above.
The comparison functionality of SOLIDWORKS Simulation and Flow Simulation is just one of the many great tools available to post-process results. I hope you can use it to your advantage as you evaluate your SOLIDWORKS designs.
Kurt Kurtin
CATI Technical Manager, Simulation and Electrical Products
www.cati.com