SOLIDWORKS: Flow Simulation Trajectory Plots
Flow Simulation Trajectory Plots
Trajectory plots in SOLIDWORKS Flow Simulation can be very informative for flow visualization; however, it is sometimes tricky to get what you want when using them with external flow results. I’ve found that for the starting point reference, sketches with patterned lines will generate a nice set of trajectories. Also, using planes that are parallel to the dominant flow direction can be useful. This reference selection choice is counter-intuitive but produces surprisingly good results.
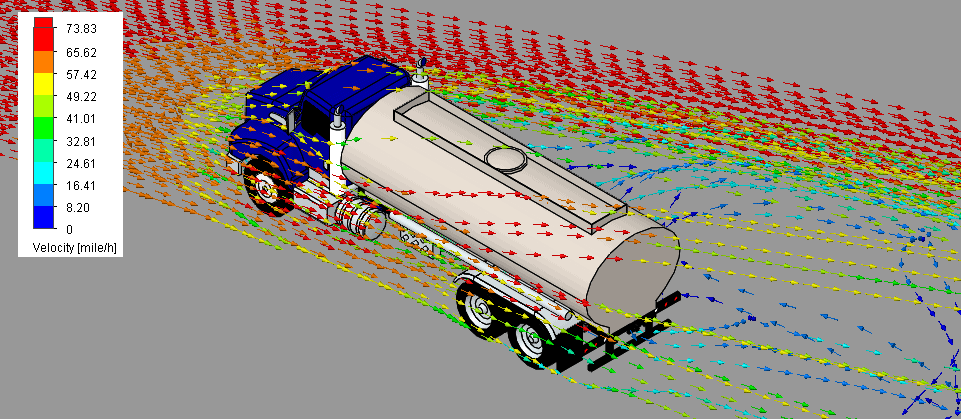
Below is an example showing a tanker truck moving down the highway at 65 MPH in a 25 MPH crosswind. The large blue arrow is the resultant velocity vector for the flow field:
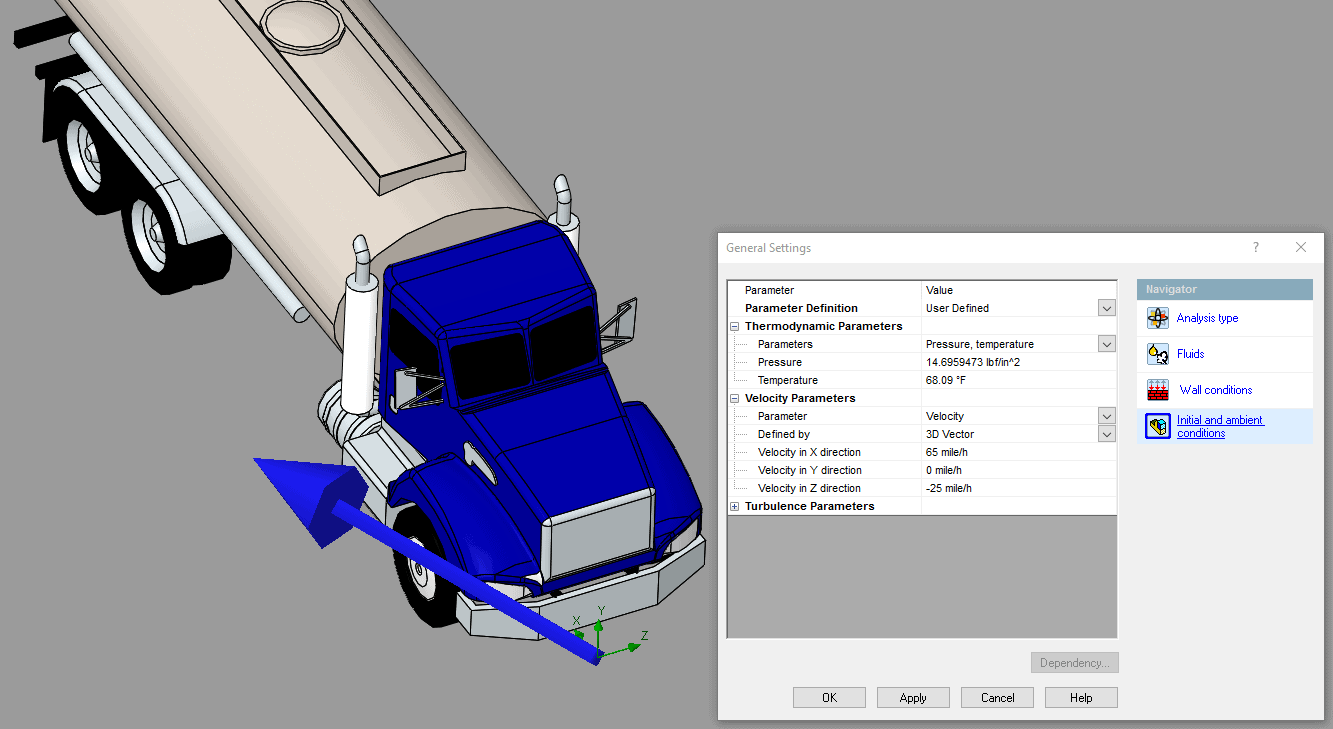
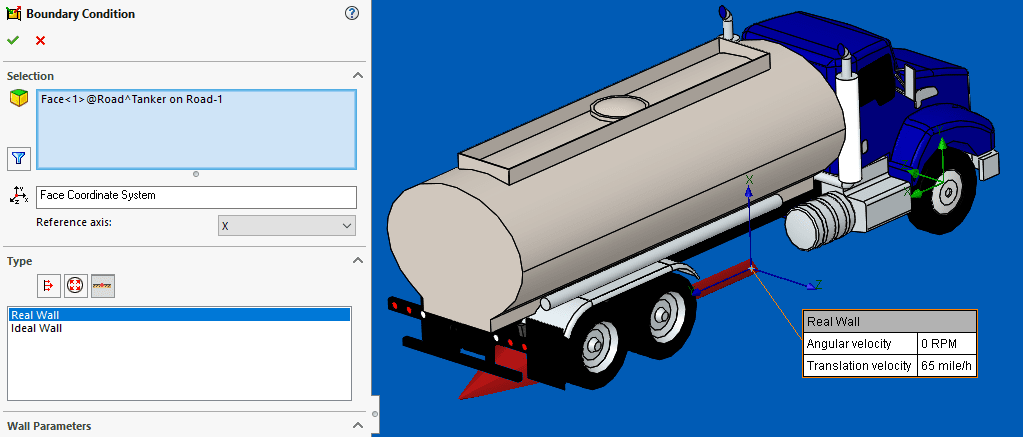
To capture the effect of the truck traveling over the road, a real wall boundary condition was applied to the road surface with a wall velocity of 65 MPH (partially hidden red vector).
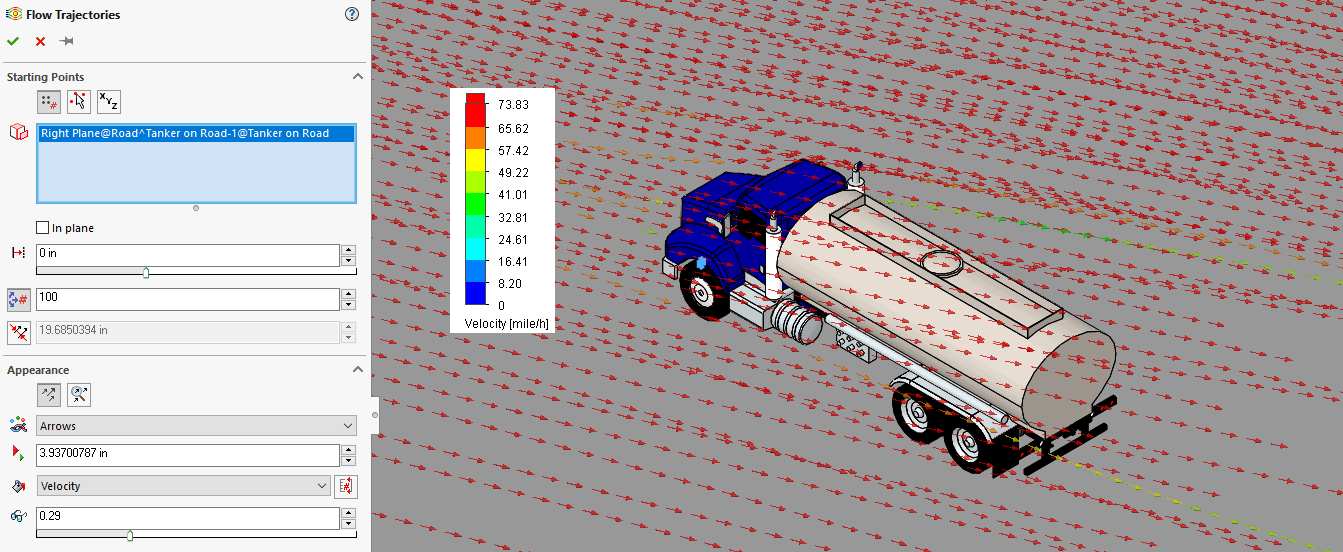
After solving, it’s easy to set up a trajectory plot using as a starting point reference one of the system planes that the flow passes through. The program generates a single trajectory at all the points on the reference entity and shows how they continue through the computational domain. In my case, 100 trajectories are created. The resulting plot provides limited detail, since the plane spans the entire computational domain and the points are evenly distributed across it. We can increase the number of points for the plot, but that usually only makes the plot more cluttered.
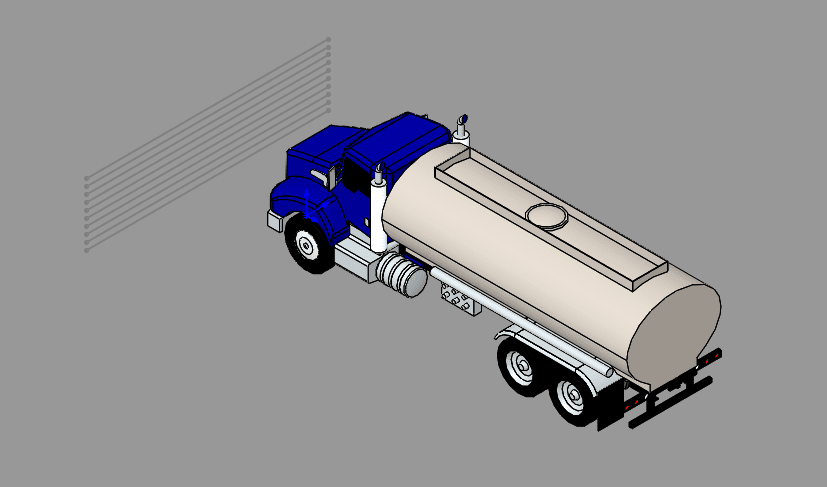
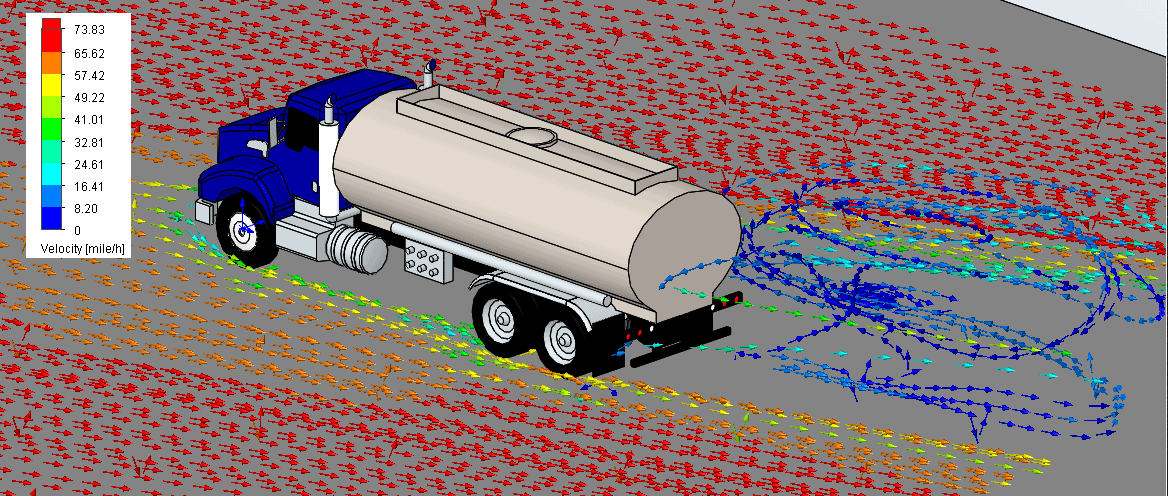
A better approach is to produce a sketch for the starting point reference, which focuses the trajectories around the area of interest. The sketch I used is situated just ahead of the truck and contains a group of patterned lines.
The result is much better. I used the same number of points (100) in the definition of this trajectory plot but used the sketch as the reference instead of the plane. We get better visualization of the flow moving over the truck and can see evidence of a recirculation zone.
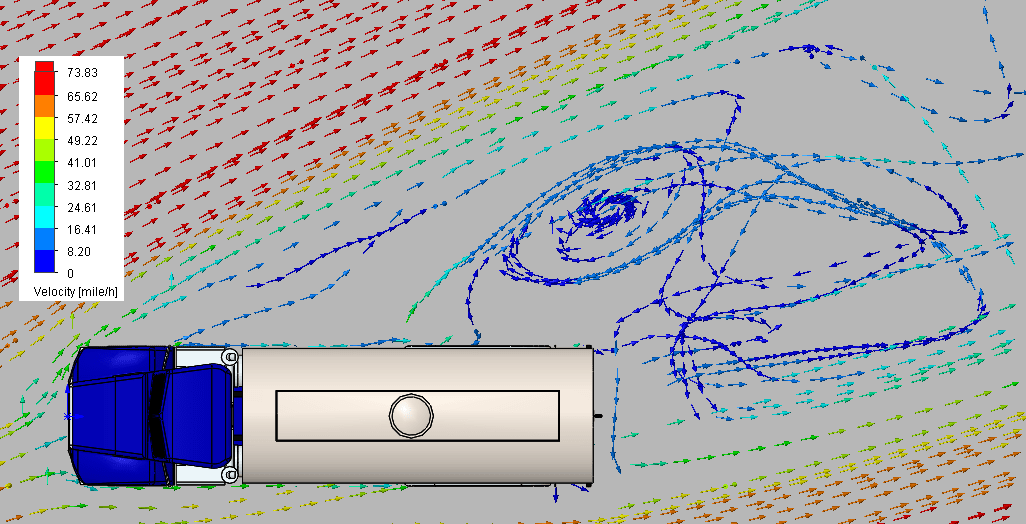
Another plot was set up, using as a reference plane that is parallel to and slightly above the road surface passing through the wheels. The trajectories are displayed even after they cross the reference plane. This shows a pronounced recirculation zone behind the truck as turbulence disturbs the flow and redirects it.
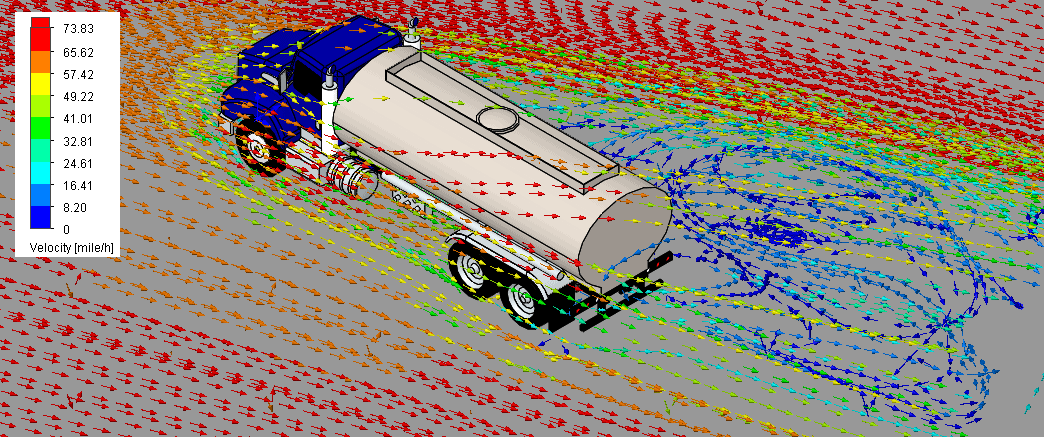
Showing these two plots simultaneously captures the overall flow field very well.
So, get creative with your trajectory plots in SOLIDWORKS Flow Simulation! This is just one aspect of their setup. Other effects can be achieved using dynamic trajectories, appearance changes (pipes, bands, spheres, etc.) and cropped regions. Also, try the “Play” feature to see them in action.
Thanks for reading, keep it Flowing!
Kurt Kurtin
Sr. Application Engineer
Computer Aided Technology