SOLIDWORKS Simulation: Draft Quality and High Quality Elements - Part 2
Have you ever proofread your own writing a dozen times and not recognized a mistake? Well, in Part 1 of this blog I did just that. It must have been the lucky number 13 re-read to realize my blunder! My original premise was to use the same number of nodes along any edge in the finite element model. So, when I referenced Part 1’s ‘Figure 5‘ and wrote: “The difference in results between 3 high quality elements and 4 draft quality elements is 0.0029 mm, or 3.1%, based upon this finite element model.” I was looking at horizontal axis numbering. Recall, however, that for each high quality element there must be two draft quality elements to achieve an equal number of nodes. So that sentence (and several others) should be re-written to say something along the lines of “3 high quality elements compared to 8 draft quality elements”. While I am tempted to make the corrections in that blog, it’s been published over a month. To date, nobody has caught my mistakes so that incorrect version shall live on. I am, however, considering docking the pay of my proof-reading staff. Gentlemen, you know who you are! On to Part 2.
Continuing with determining the accuracy of SOLIDWORKS Simulation results using draft and high quality elements, I’m going to work with four additional SOLIDWORKS part files of increasingly complex geometry. In Part 1 where I used a cuboid, the shape is easily created by stacking several tetrahedral elements, each with no distortion needed to generate the final shape. More realistic CAD models with holes, fillets, and other curved geometry require a bit more work to accurately mesh. With draft quality, more elements are necessary to map the geometry due to the tetrahedral faces remaining planar. With high quality I may still need more elements, however, you’ll recall that the edges and faces do not need to remain straight and planar. Each of the four part files will be meshed with the same guidelines used in Part 1. I will start with a minimum of one high quality or two draft quality elements along the shortest edge to create 3 nodes along that same edge. Design studies will again be used to increase the number of elements along the shortest edge, this time from one to ten high quality elements and two to twenty draft quality elements.
The first part is a cantilever bracket, fixed on the left, vertical face with a uniform force acting vertically downwards on the top face. The three holes and the triangular cutout with fillets add some curved geometry to the model (Figure 1). The cantilever bracket is 5 millimeters wide, which provides the starting element size for both high and draft quality meshes.
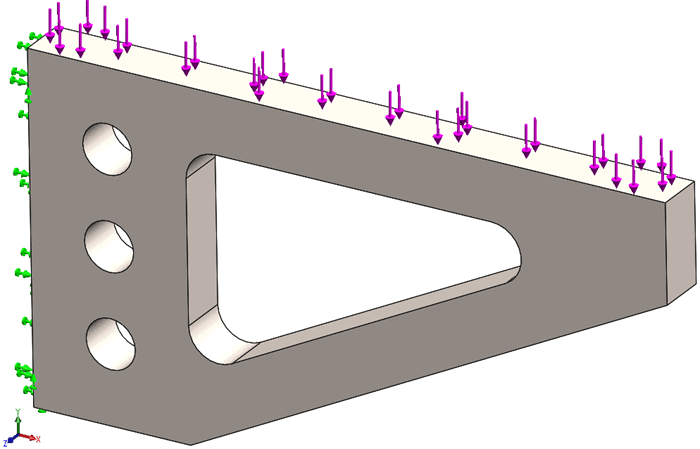
Figure 1
Reviewing the design study results calculated from the cantilever bracket (Figure 2) you will notice that the maximum displacement doesn’t change significantly after 4 high quality elements through the thickness. While there is a slight increase in maximum Von Mises stress beyond test 4, the change is less than 5% which I consider to be an acceptable amount of error. With four high quality elements through thickness, the maximum stress is 115 MPa. This requires twelve draft quality elements through the thickness to reach 115 MPa. From test 5 onward – five high quality or ten draft quality elements – the difference in calculated stress is less than 4.7% when an equal number of nodes are used. While the maximum displacement results seem to indicate a continual lag between high quality and draft quality elements, the difference is less than 0.0006 mm from 4 high or 8 draft quality elements and beyond. I’ve only encountered a handful of Quality Control departments that can accurately measure something this minuscule, so I think it’s safe to assume the displacements are essentially equivalent from test 4 onward.
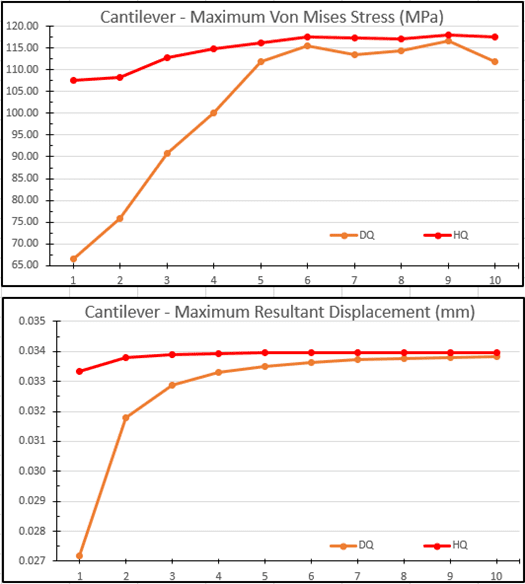
Figure 2
The second model is a quarter-symmetric portion of a Clevis (Figure 3). Appropriate symmetry restraints have been applied to the cut faces and a fixed restraint has been added to the cylindrical face where the Clevis would be bolted to another component. A bearing load has been added to represent pulling on the Clevis through the large hole, like would occur if a pin were in place in the assembly. This model has two cylindrical faces and several fillets of different sizes to challenge my testing.
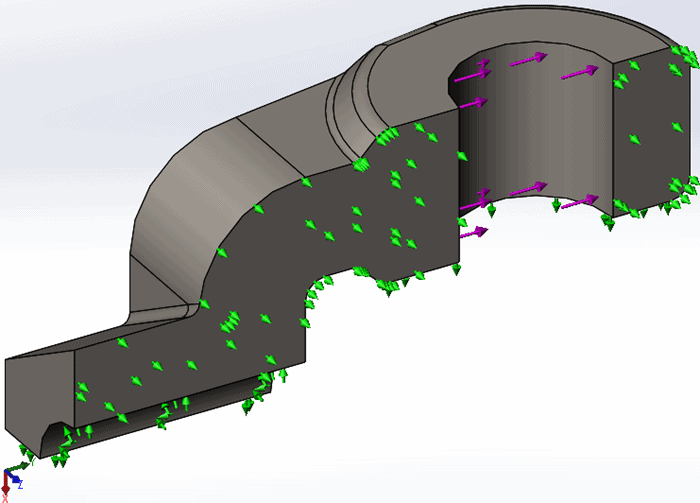
Figure 3
The results of the test battery on the Clevis can be seen in Figure 4. Looking at the stress results, had I been working through a manual mesh convergence process I would have stopped at either test six or seven (high quality elements) where the maximum Von Mises stress is approximately 255 MPa. Comparing that with draft quality stress results, the magnitude of Von Mises stress is approximately 20% lower than that of the high quality elements for tests seven through ten. The reason for the discrepancy is twofold. First, there is a stress concentration near the small fillet between the hexagonal shape and the vertical, flat face with the symmetry boundary constraint applied. Second, it isn’t until the global mesh size is small enough that more than one element is created to map the small fillet geometry. The trial with 18 draft quality elements has a maximum stress in the range of the trial with only 3 high quality elements; a huge difference in the number of elements needed due to the singularity and mesh resolution. The displacement results from the Clevis test follow that of the Cantilever. The test with eight draft quality elements is within 2.8% of the test with four high quality elements. For each test with more elements than trial 4, the displacement results differ less than 2.3% from draft quality to high quality meshes.
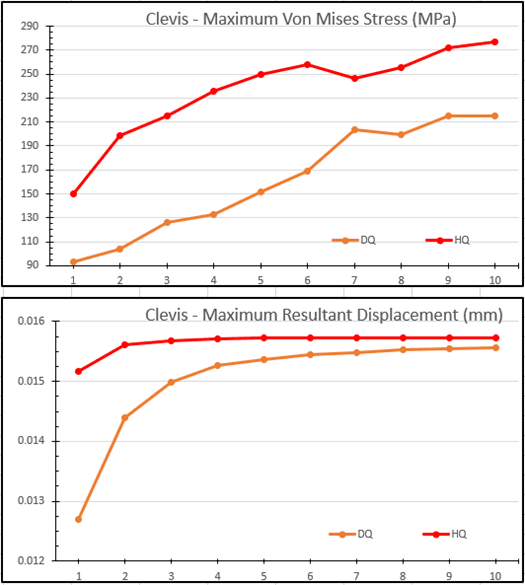
Figure 4
The third model is a one-sixteenth wedge of an impeller (Figure 5). This part includes multiple curved faces and fillets, even further challenging the mesh testing than the previous two SOLIDWORKS part files. The impeller is fixed on the ID face, has three sets of cyclic symmetry restraints applied, and a roller-slider restraint on the bottom, flat face. The impeller is subjected to a centrifugal load with the axis of rotation at the center of the ID cylindrical face.
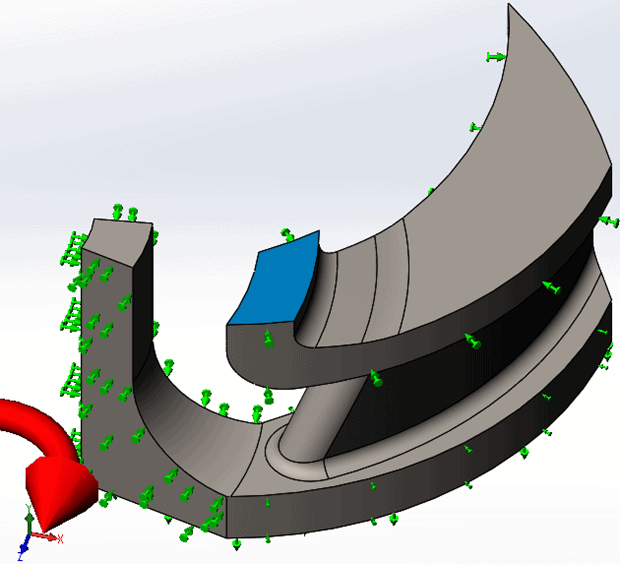
Figure 5
The results of the mesh testing for the impeller are found in Figure 6. The high quality mesh stress results vary by 3.2 MPa when using anywhere from two to ten high quality elements. While the stress appears to be diverging, this minimal difference between the successive tests would be considered converged after four high quality element trials. Like the prior draft quality tests, the stress results lag the high quality results. Using any mesh with ten or more draft quality elements indicates an average stress roughly 15% lower than similar trials with high quality elements. That 15% represents a difference of less than 4.6 MPa across trials 5 through 10. The displacement results show the now familiar data lag. The difference, however, is less than 6% when using eight or more draft quality elements compared to similar tests with half as many high quality elements.
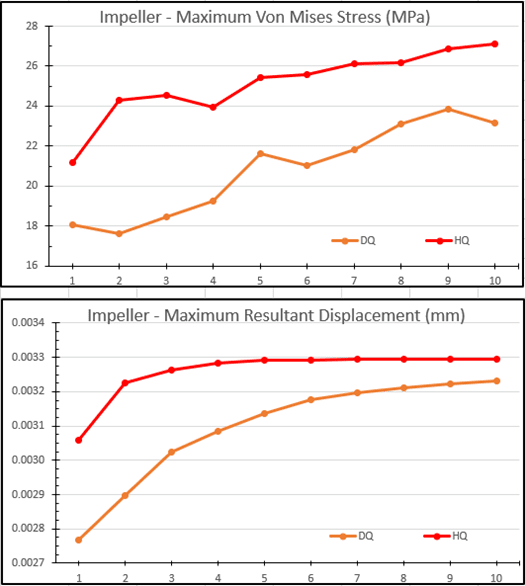
Figure 6
The fourth and final model is a support bracket (Figure 7), one component of a multi-part assembly. The support bracket has a roller-slider restraint on the bottom, horizontal face and a fixed hinge restraint on the lower, large thru-hole. A remote load is applied to the upper thru-hole representing where a long rod would have an upward force applied, offset from the part geometry. There are multiple fillets and holes along with varying wall thicknesses for this part. While the rib on the back of the part is 10 mm thick, the fillets are much smaller which will definitely influence the meshing trials.
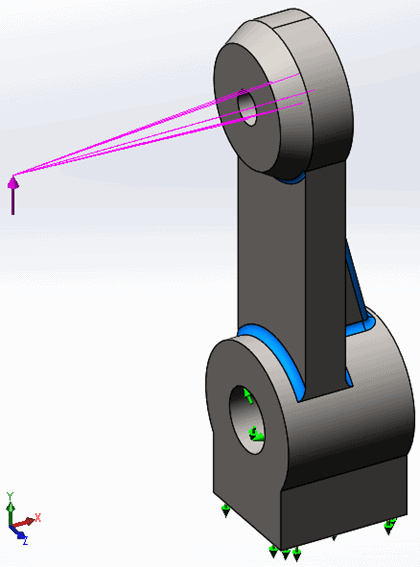
Figure 7
The results for the support part are shown in Figure 8. Regarding the high quality mesh stress results, if you toss out the first and tenth trial, the stress varies less than 20 MPa . I can confidently ignore the first data point as one high quality element isn’t enough to calculate an accurate stress in almost all cases. The trial with ten high quality elements might seem a little puzzling. In reviewing the stress distribution for this trial, the small fillet on the bottom side of the chamfered feature (where the remote load is applied) is where the maximum stress occurs. Until the trials reach the smallest of element sizes, this fillet is meshed with a single element – not enough for an accurate result in this region. Honestly, this is more of a problem with the approach to this mesh comparison – globally changing the mesh size – than the actual results. From trial 3 to 9, the difference in stress between high and draft quality averages 11%. Those same trials exhibit less than a 3% difference in resultant displacement.
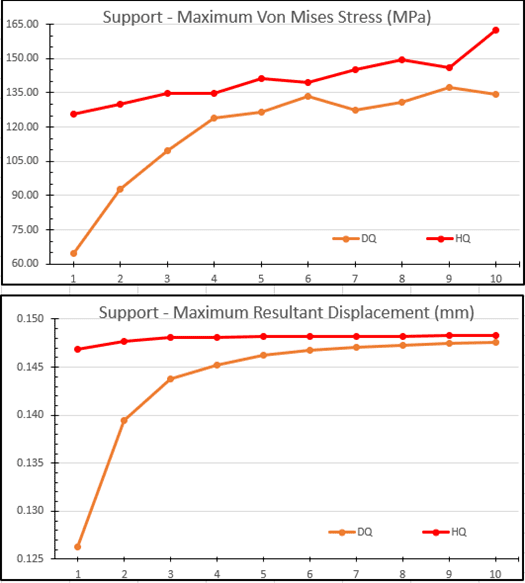
Figure 8
Having gone through this exercise with the cuboid from part 1 and now four additional part files, I think there are several takeaways from this mesh testing. The obvious point is that it is difficult to achieve the same magnitude of stress results with a draft quality element compared to a high quality element. If you understand how stresses are calculated in tetrahedral elements, you know the “why”. For more information on this topic, research Gauss Points or Quadrature Points.
The second point is you can achieve nearly the same displacement results regardless of using draft or high quality elements, provided you use enough draft elements in the mesh. Aside from my incorrect assumptions in Part 1, in general, it seems to require more than double the amount of draft quality elements to achieve similar displacement results. A single draft quality element has twelve total degrees of freedom, the translations in X, Y, and Z at each node. Contrast that to a single high quality element with 30 total degrees of freedom from the ten nodes. If you need to use more than twice as many draft quality elements to achieve reasonable displacement accuracy, are you really saving computation time? Most of the time that answer is a definite no.
The third takeaway is the more complex the geometry, the harder it is for draft quality elements to adequately represent the CAD model. In hindsight, on the models with small fillets, I should have started my mesh size closer to the fillet radius and not the thinnest wall. That approach, however, would have created huge finite element models since my approach was to refine the global mesh size. This approach is not recommended unless you’re working through an academic exercise, such as this. The better approach is to follow a mesh convergence process where the mesh is only refined in high stress regions.
So, can you achieve accurate results regardless of draft or high quality elements in the mesh? I believe you can, assuming you use enough elements in the mesh. Because it’s all about the nodes and equations, right Chris! All things being equal, which they are not, I would tend to use draft quality elements for coarse mesh troubleshooting my finite element models and high quality elements when I am working towards “the answer” to my FEA question. After reviewing stress and displacement results for these five different finite element models, what conclusions would you make? Now go make your products better with SOLIDWORKS Simulation!

Bill Reuss
Product Specialist, Simulation
Father, golfer, coffee connoisseur, computer nerd
Computer Aided Technology, LLC