SOLIDWORKS TECH TIP: Meshing Tips and Tools for Better Results (Part 2)
Since I am always being asked what makes a good mesh, I decided once again to blog about a list I put together a while ago. This was a general list, in no particular order, of things you can do, things you can use, and things you can look for in creating a mesh. And knowing you have a good mesh, you can feel better about the results you are getting. This is part 2 in the series and will discuss a couple of advanced options.
Have you ever wondered what those advanced options are for in your Stress Plot Property Manager? There are two advanced options that we find when we are creating or editing the definition of a stress plot. You can see them below, labeled Node Values and Element Values, and they provide some pretty different-looking results.
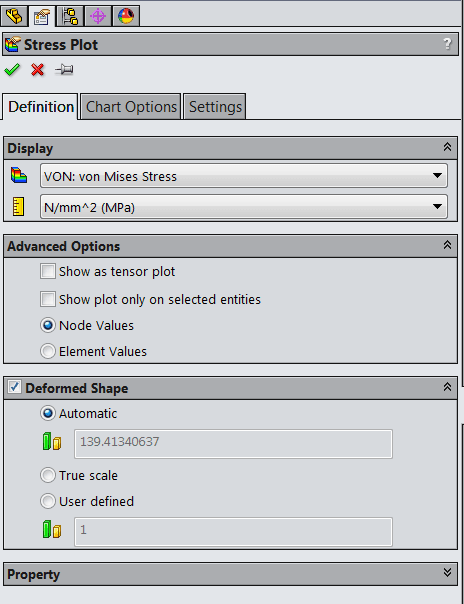
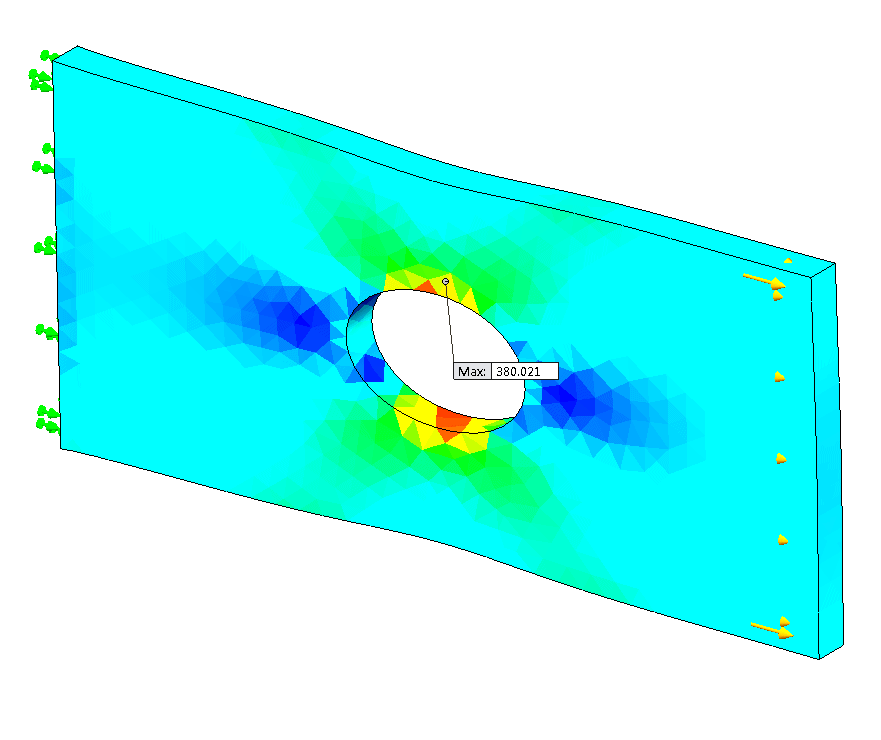
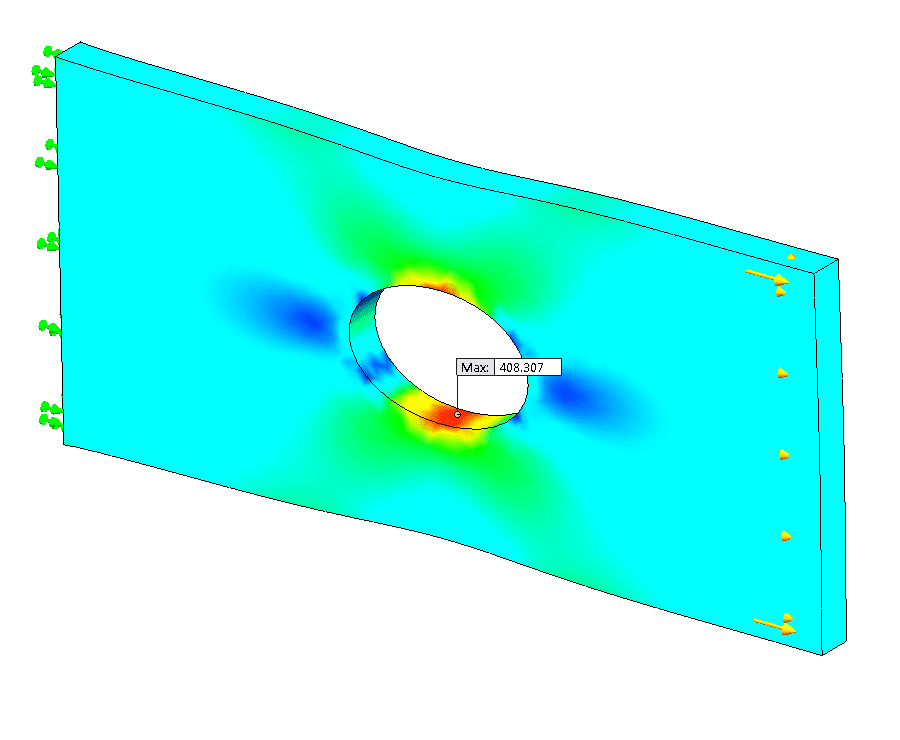
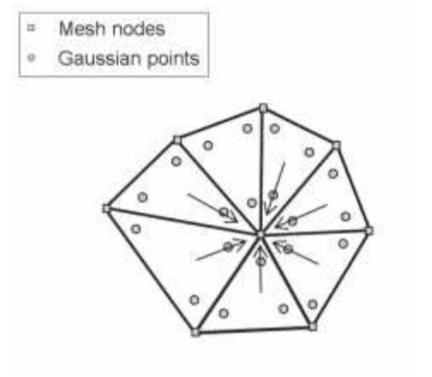
The stress plot that displays Nodal Values appears smooth, while the stress plot that displays Element Values appears rough. To understand these different appearances, let’s explain the differences between nodal and element stresses.
Now whether any of this makes sense, the “check” is pretty simple. Element stresses and nodal stresses are always different, but too large a difference indicates that the mesh is not sufficiently refined in that location. In our plate analysis above, we can see that the maximum stress for the Node Plot is 408 MPa, whereas the maximum stress for the Element Plot is 380 MPa. These values SHOULD be relatively close, but since they are not, we should definitely refine our mesh. And finally, one could also do a visual inspection on the Element Plot, once again looking for spotty results.
For more training and tutorials on the many 3D CAD Modeling solutions in the SolidWorks family of products and add-ons, register for an upcoming Event or look into our SOLIDWORKS training.