Top Three Display Enhancements in 2016 Simulation
The 2016 Simulation release offers three big display enhancements. Every year SOLIDWORKS Simulation adds enhancements to the package that help the users be faster and smarter. These display enhancements do both.
Equation-Driven Results
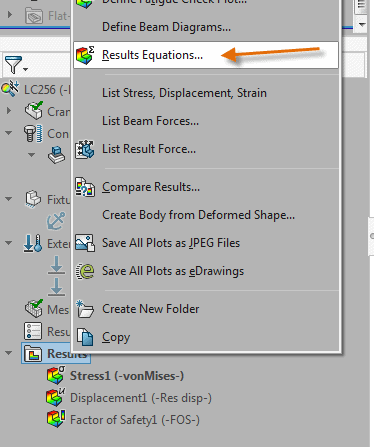
The First display enhancement is “Equation-Driven Results”. Equation-driven results allow the user to combine parameters of the Simulation plots. For example the user has access to the Triaxial stress (P1: 1st Principal Stress+P2: 2nd Principal Stress+P3: 3rd Principal Stress), by default however if the user wanted to only combine P1, and P2 the new equation driven results would allow this to be added and displayed.
To access the equation-driven results Right Mouse Button on the results folder and choose “Results Equations”.
Select plot variables and combine with standard functions.

Remote Mass and Load Results
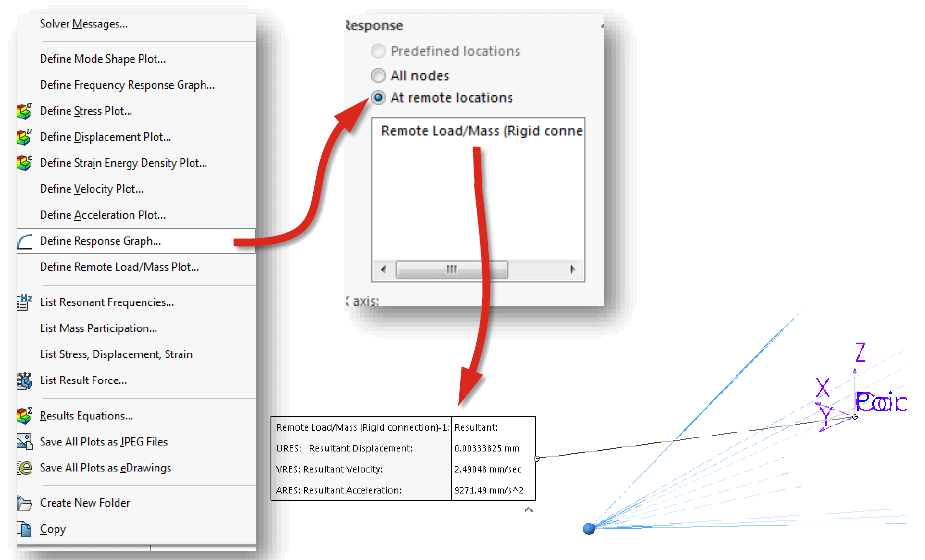
The second display enhancement is the Remote Mass and Remote Load results display. The user can now show response graph results for remote loads and masses in Linear Dynamic Studies. To access the plots Right Mouse Button on the results folder and choose “Define Response graph”.
Maxima and Minima Color Option
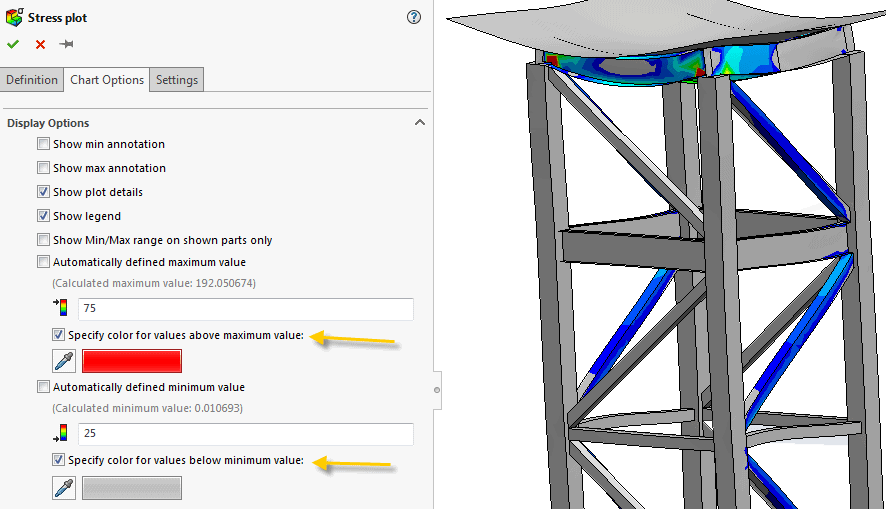
Last but not least the display plots have a new Maxima and Minima color option. This option allows the user to specify specific colors for and upper and lower bound. This helps the user focus on the range of values of most concern. To do this edit the chart options of the plot and specify the upper and or lower bound values and corresponding colors.
2016 SOLIDWORKS Simulation contains several enhancements including the previously mentioned display changes. All of the enhancements help the user to be better, faster, smarter.