Understanding beam diagrams in SOLIDWORKS Simulation
When conducting a finite element analysis (FEA) of a weldment structure in SOLIDWORKS Simulation, the software will default to meshing each structural member using beam elements. Beam elements are one dimensional finite elements, where the section properties of the beam (inertia, cross sectional area, torsion constant, etc.) are accounted for in the mathematical model as opposed to the geometrical model. In other words, when we use beam elements to mesh an extruded shape, we don’t subdivide the cross section of the beam into small elements. Rather we account for properties of that cross section in the derivation of the model’s stiffness matrix. This makes beam elements computationally efficient and able to solve much faster than shell or solid elements, making them the ideal element choice for extruded shapes and weldment structures.
The other good part about using beam elements is that during post-processing, we can gain valuable insight into the forces, bending moments and torque carried by beams in our model by plotting these distributions.
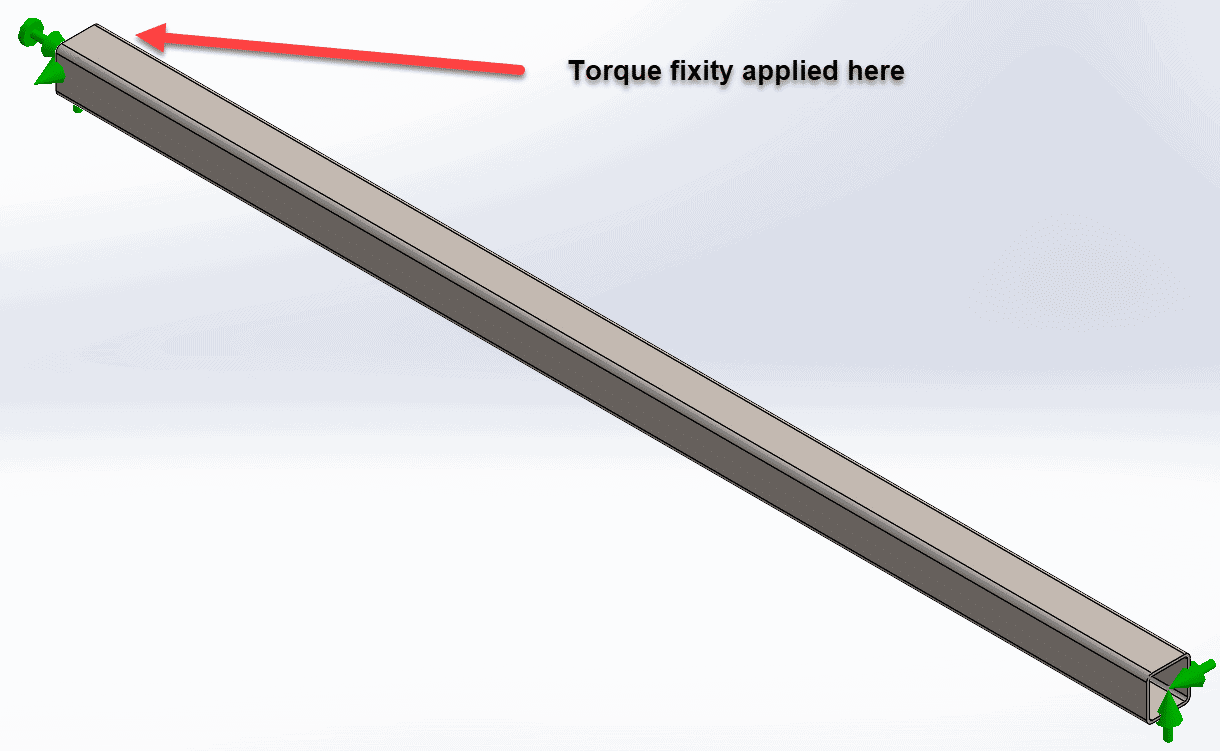
To demonstrate this functionality, I will analyze a very simple beam. My model consists of an 8ft long square tube that is 4” wide, 4” tall with a 0.25” wall thickness. The beam is simply supported on both ends, with fixity to resist torque applied to the left end.
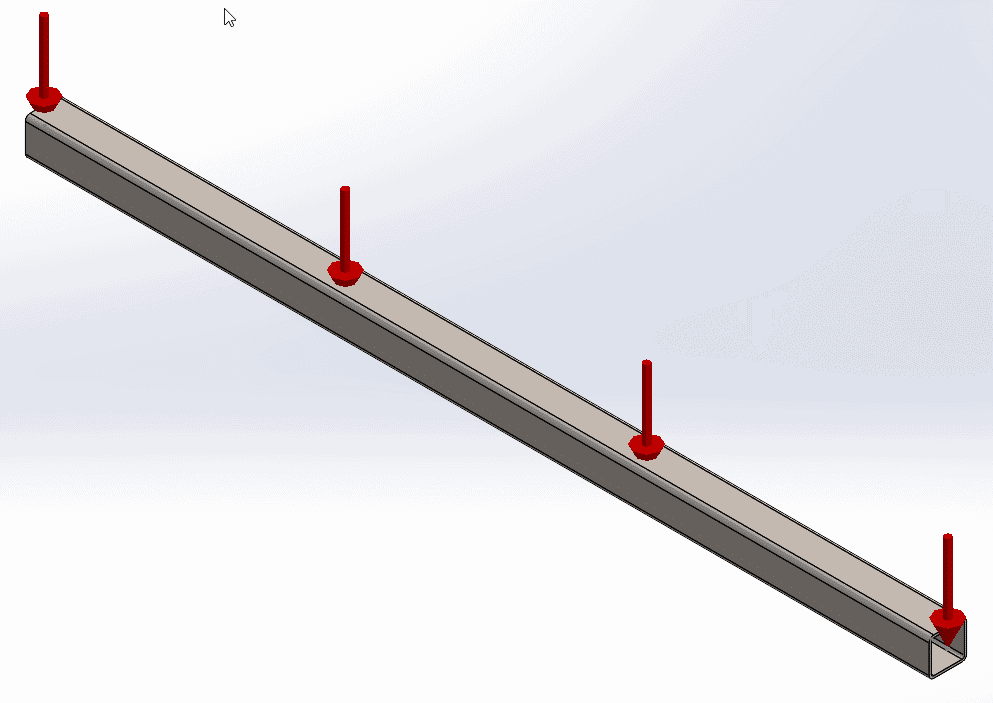
The beam is subjected to 3 loads as follows:
- Uniformly distributed vertical load of 2,000lbs to the entire beam
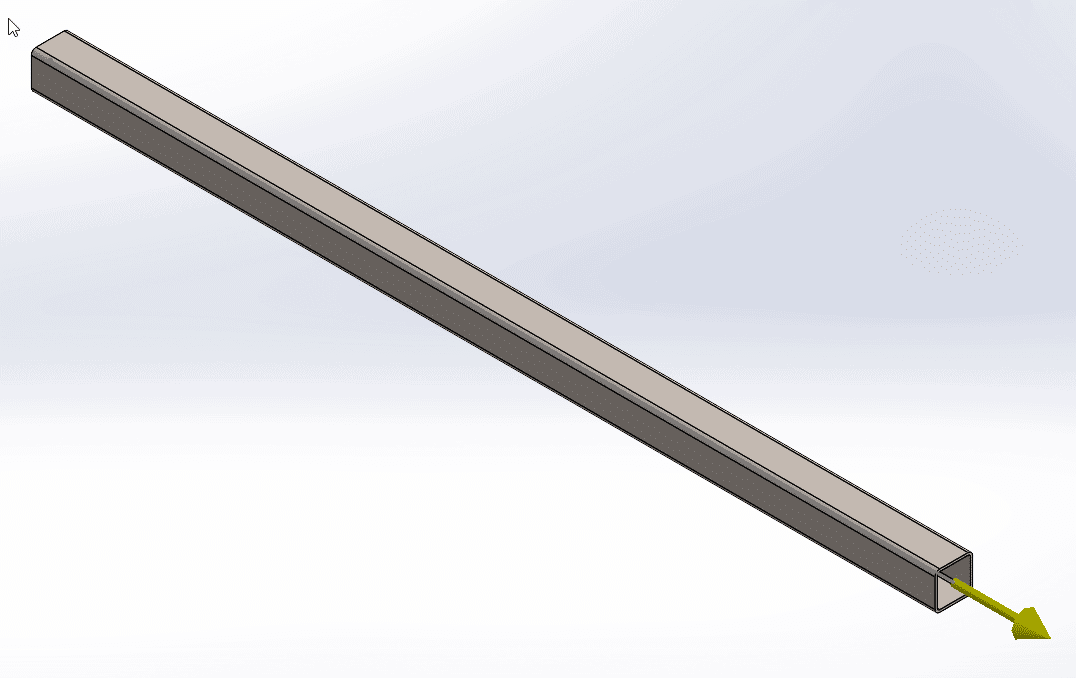
2. Axial tensile load of 10,000lb to the right end
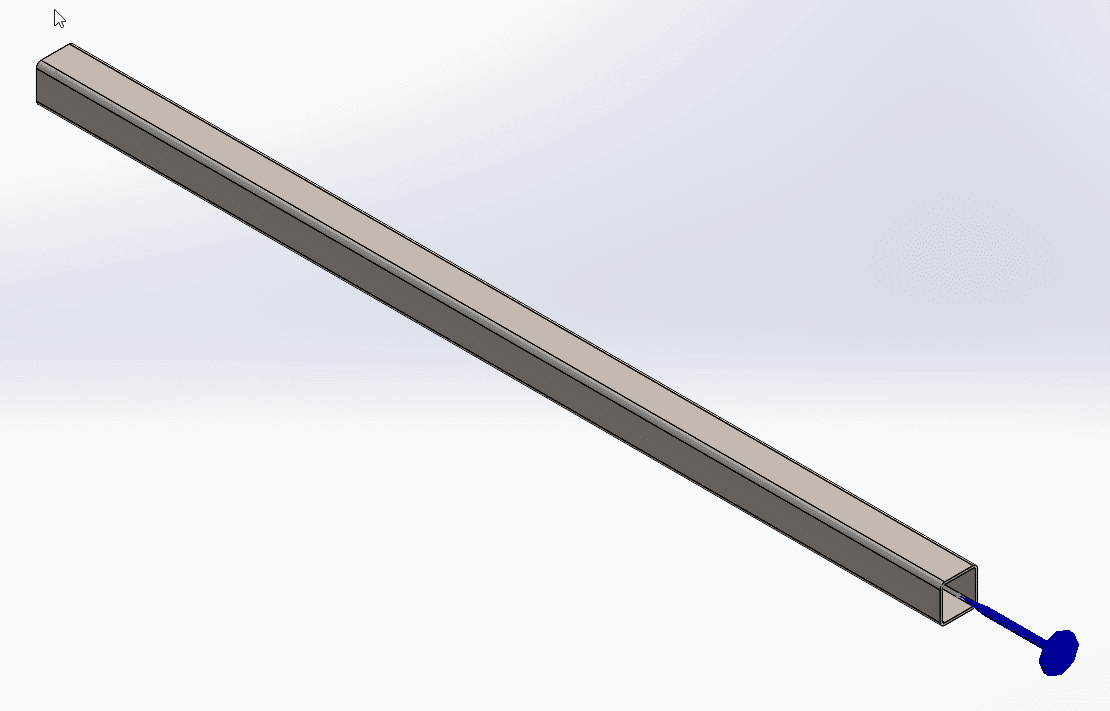
3. Torque of 15,000lb.in in a clockwise direction to the right end
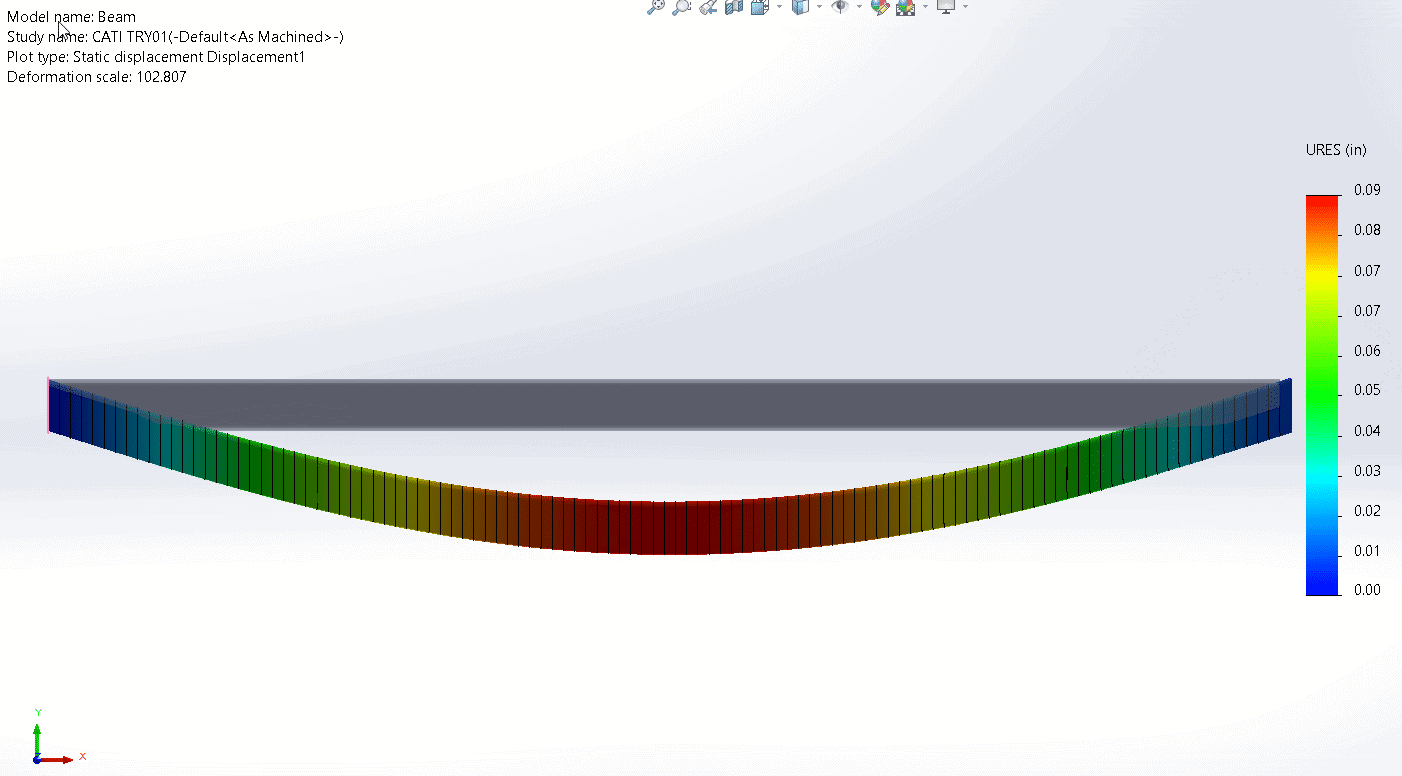
The deformed shape (exaggerated) in profile is shown below, superimposed on the undeformed shape.
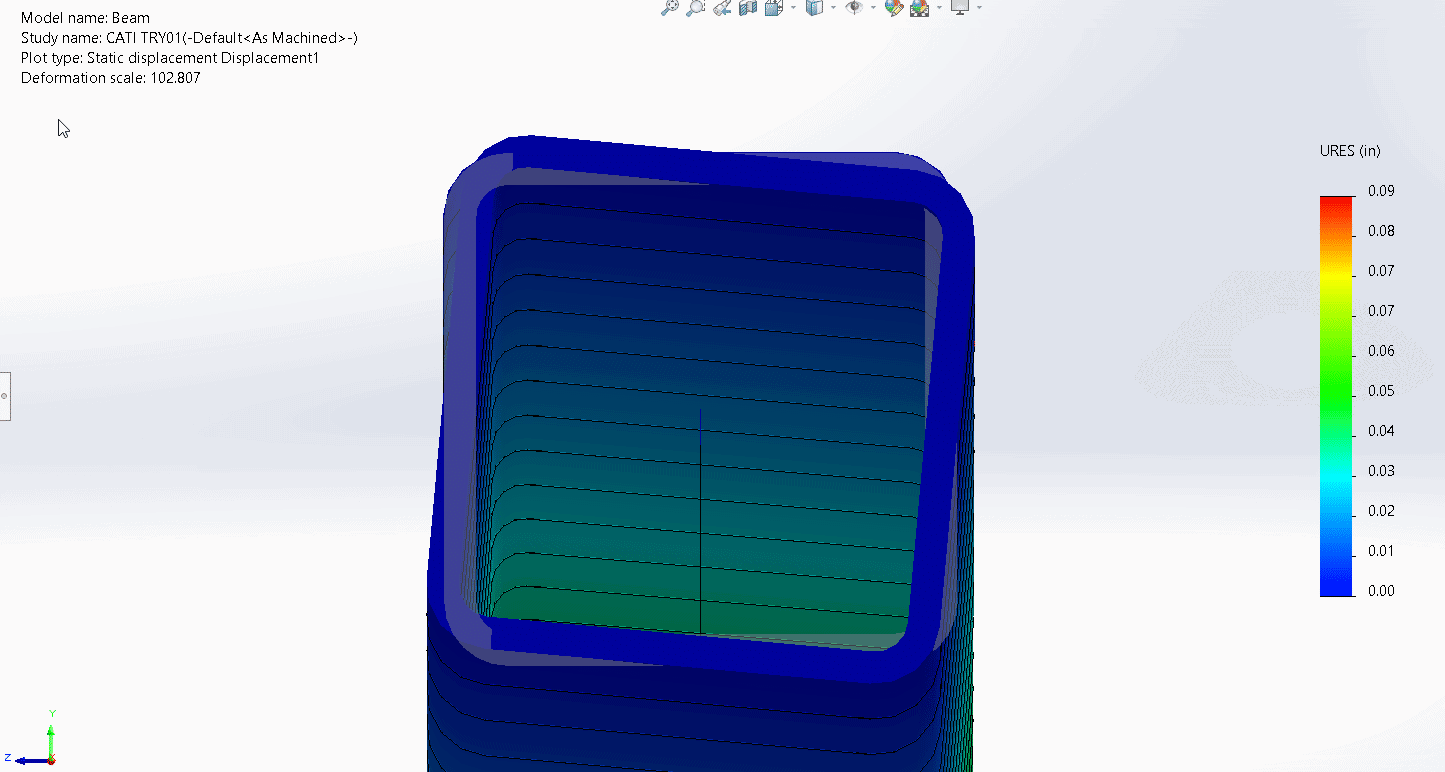
To illustrate the twisting effect of the torque, the deformed shape (exaggerated) in an end-on view is shown below, superimposed on the undeformed shape.
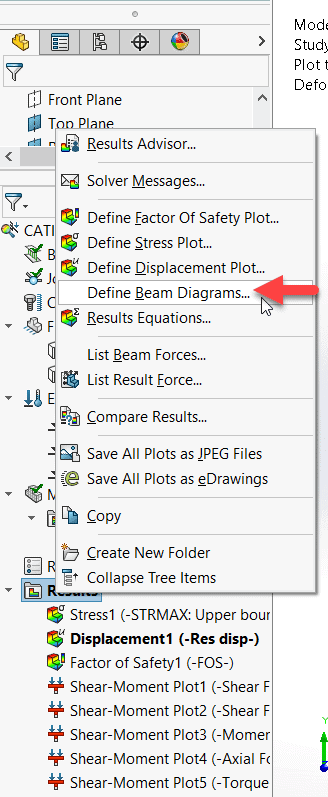
To study beam diagrams, right click on your results folder and then click “Define Beam Diagrams”.
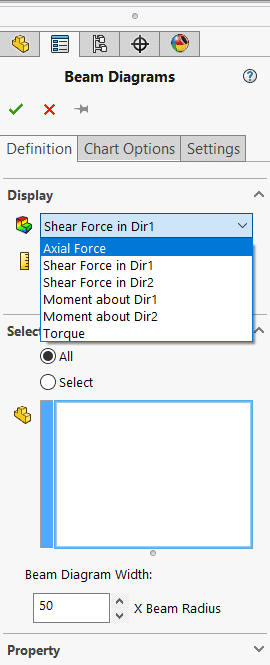
This opens the “Beam Diagrams” property manager. Use the dropdown menu labelled “Display” to choose which force/moment component to plot. The options are Axial Force, Shear Force in Direction 1, Shear Force in Direction 2, Moment about Direction 1, Moment about Direction 2 and Torque.
To understand the difference between “direction 1” and “direction 2” it is important to note that each beam in your model is assigned a local co-ordinate system with 3 orthogonal axes. You can (and should) turn the display of these on to understand the orientation of your local beam co-ordinate systems. Do this by clicking on the “settings” tab and then activate the button “Show beam directions”.
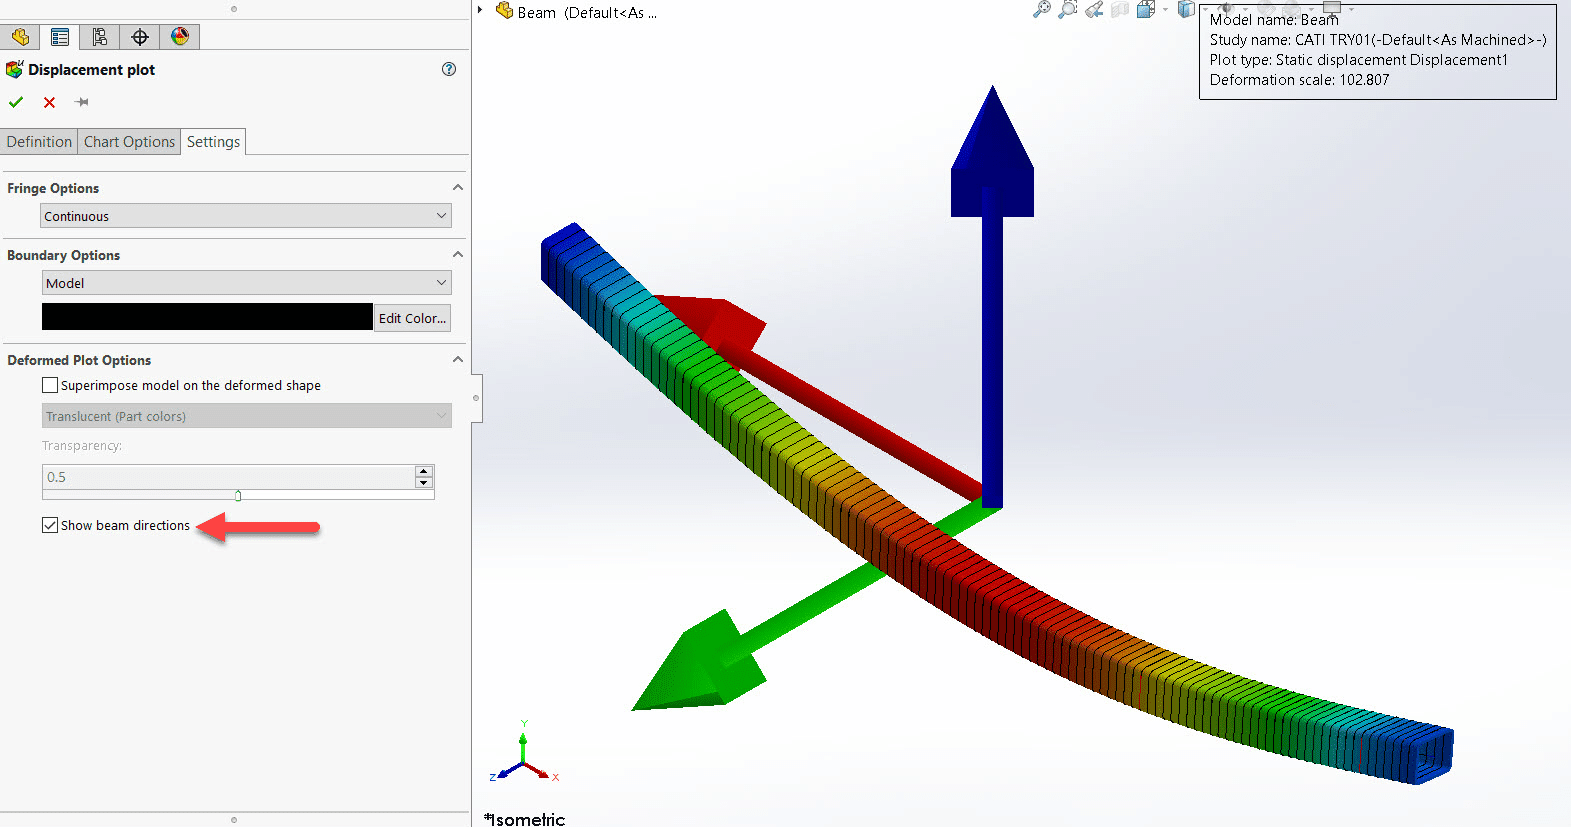
The red arrow shows the positive axial direction, the green arrow shows positive “direction 1”, and the blue arrow shows positive “direction 2”. The software plots the local triad at the center of the beam. Note that in this case the positive axial direction of the beam is actually in the negative x direction of our global co-ordinate system.
The software assigns Direction 1 (Dir 1) and Direction 2 (Dir 2) depending on the section geometry. Dir1 is parallel to the longest straight edge of the beam cross section. If the longest edge is curved, then Dir 1 is tangent to the curved edge. Dir 2 is normal to Dir 1 counterclockwise.
For example, see the beam direction assignments for different cross sections below.
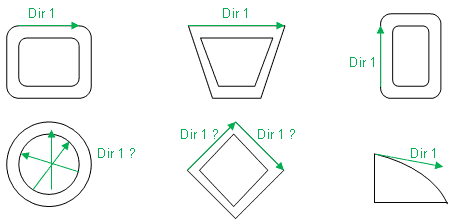
For more information on beam directions consult the help files.
With our beam triad now understood we can proceed to interrogate our beam diagram results. The axial force distribution is shown below.
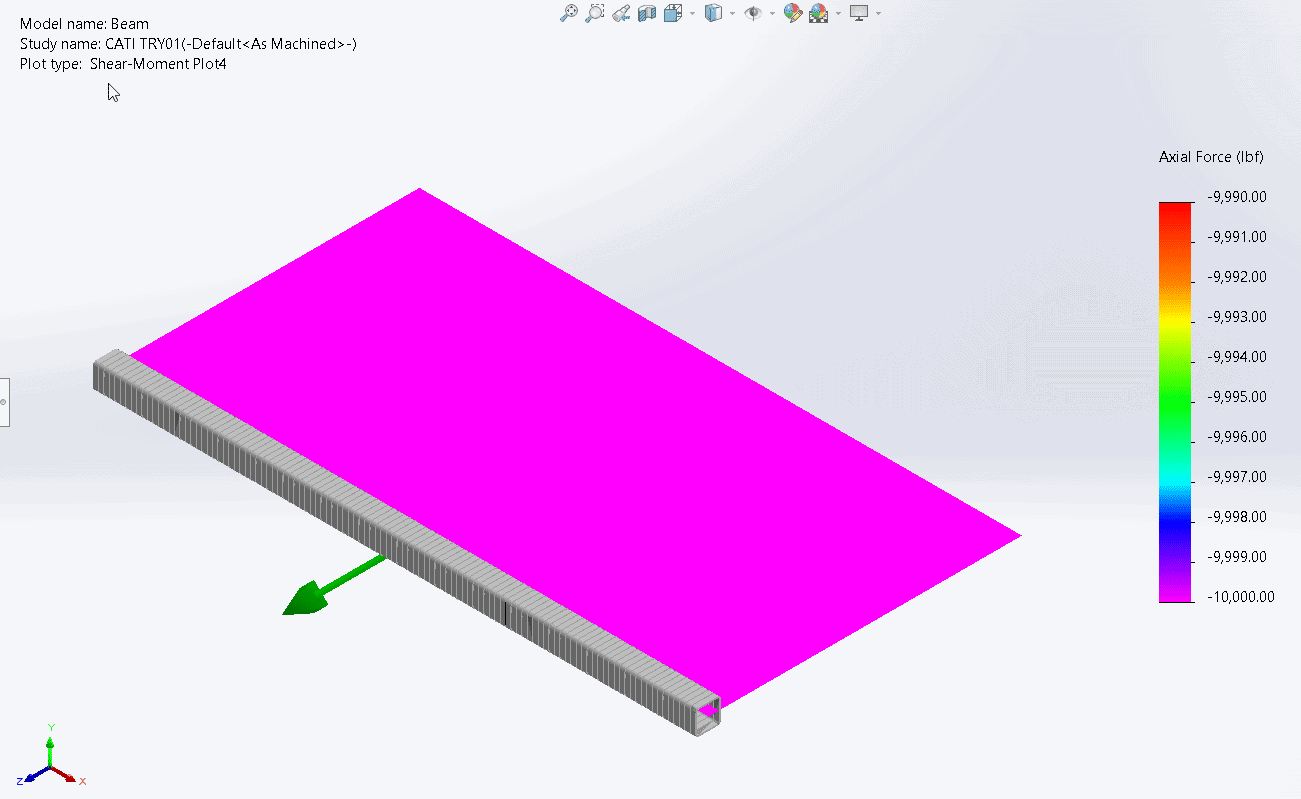
As expected, the axial force has a constant magnitude of 10,000lbs. However, you’ll note that the value listed is -10,000lbs. We applied an axial tensile load, so shouldn’t the tensile load be assigned a positive value not a negative? The answer is no. In SOLIDWORKS Simulation whether the axial load is plotted as a positive or negative number has nothing to do with whether the load is tensile or compressive. All that matters is which direction the load is applied relative to the local beam co-ordinate system. In this case the red axis of the beam pointed from right to left (in the negative global x direction). Our axial tensile force in the beam goes from left to right (in the positive global x direction), which is why it shows as a negative value in the local beam coordinate system.
The plot of shear force in direction 1 is shown below.
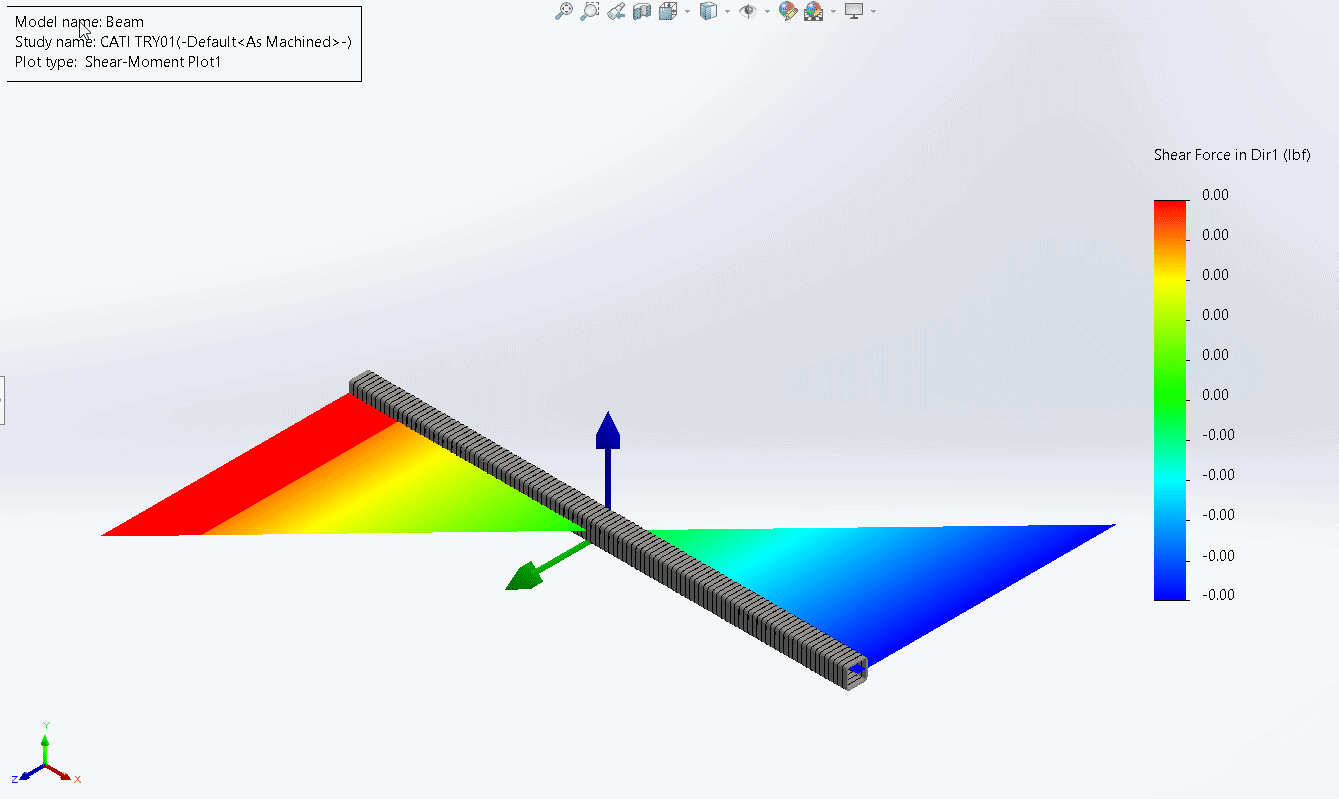
Note that the values in the legend are all zero, so you can ignore the shape. The distributed load we applied was all in the negative y direction of our global coordinate system which is also the negative “direction 2” of our local beam coordinate system. There was no load in “direction 1” of the beam, hence we get zero shear force in that direction.
The plot of shear force in direction 2 is shown below.
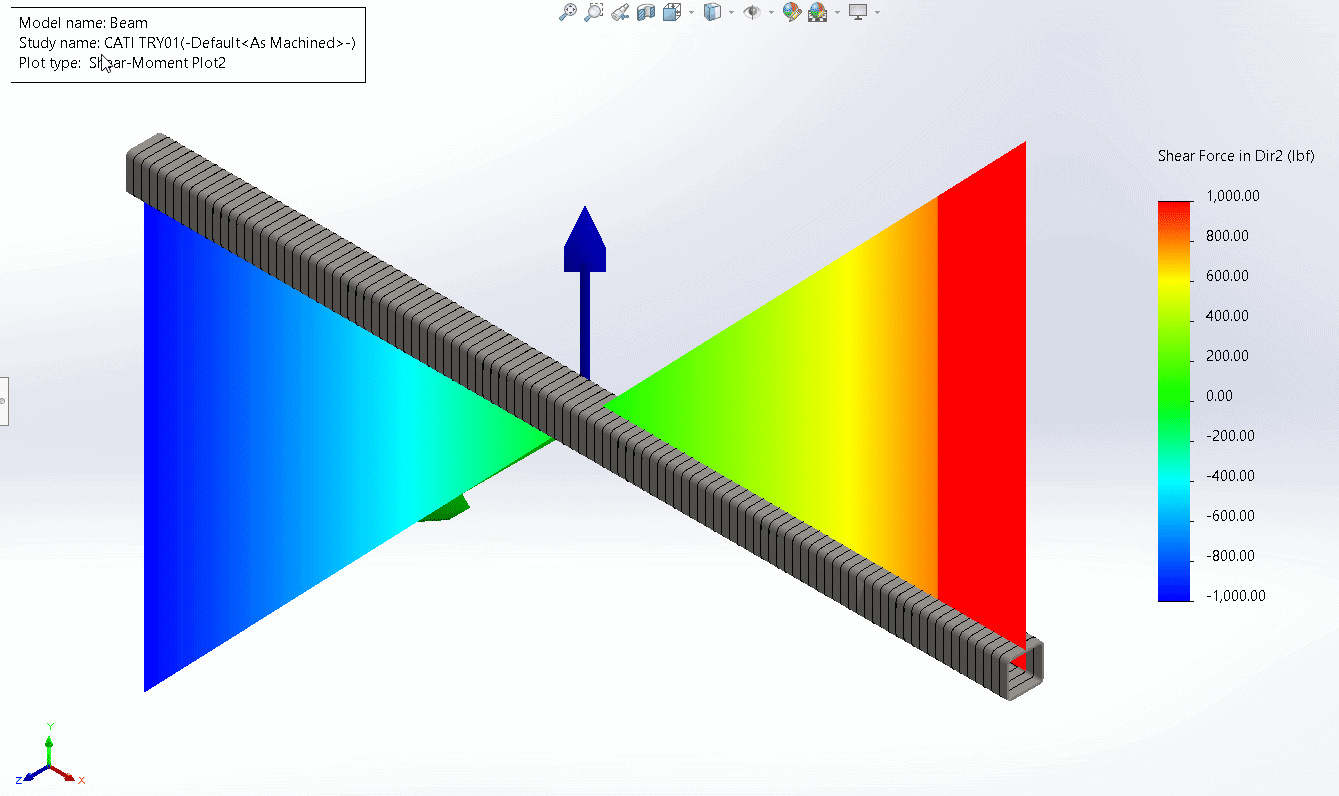
This is the familiar distribution of shear force in a simply supported beam with maximum values at the ends (1,000 lbs) equal to half the total load (2,000lbs).
The plot of bending moment about direction 1 is shown below.
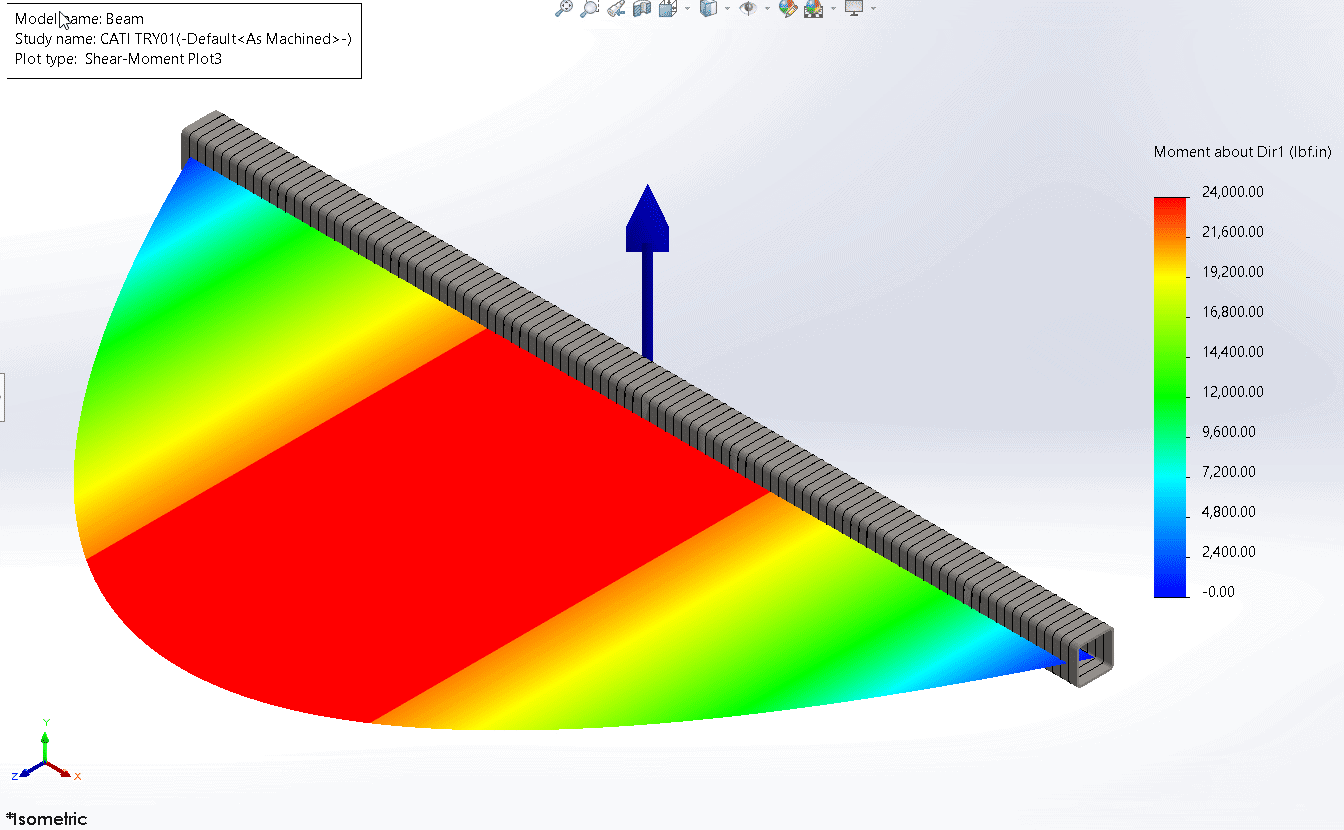
This is the familiar distribution of bending moment in a simply supported beam with a maximum value in the middle of 24,000 lb.in. You may ask yourself, if my shear force plot of interest is shown in the global XY plane, why is the bending moment plot of interest shown in the global XZ plane? The answer is that the above plot is bending moment about direction 1. Our uniformly distributed load imparts bending moments on the beam about the global Z axis (or the green “direction 1” arrow in our local beam triad). Hence this plot is shown in the global XZ plane (in this case). This can be a little confusing because when we took Engineering 101 in college and learnt to plot beam diagrams, we always showed shear force and bending moment plots in the same plane. I attribute this to the fact that the pages of a textbook or the notepad we were sketching on only has one useful plane. When we do this on paper, it is not possible for us to graph in a plane perpendicular to the page of our notebook. In SOLIDWORKS 3D CAD we don’t have that limitation.
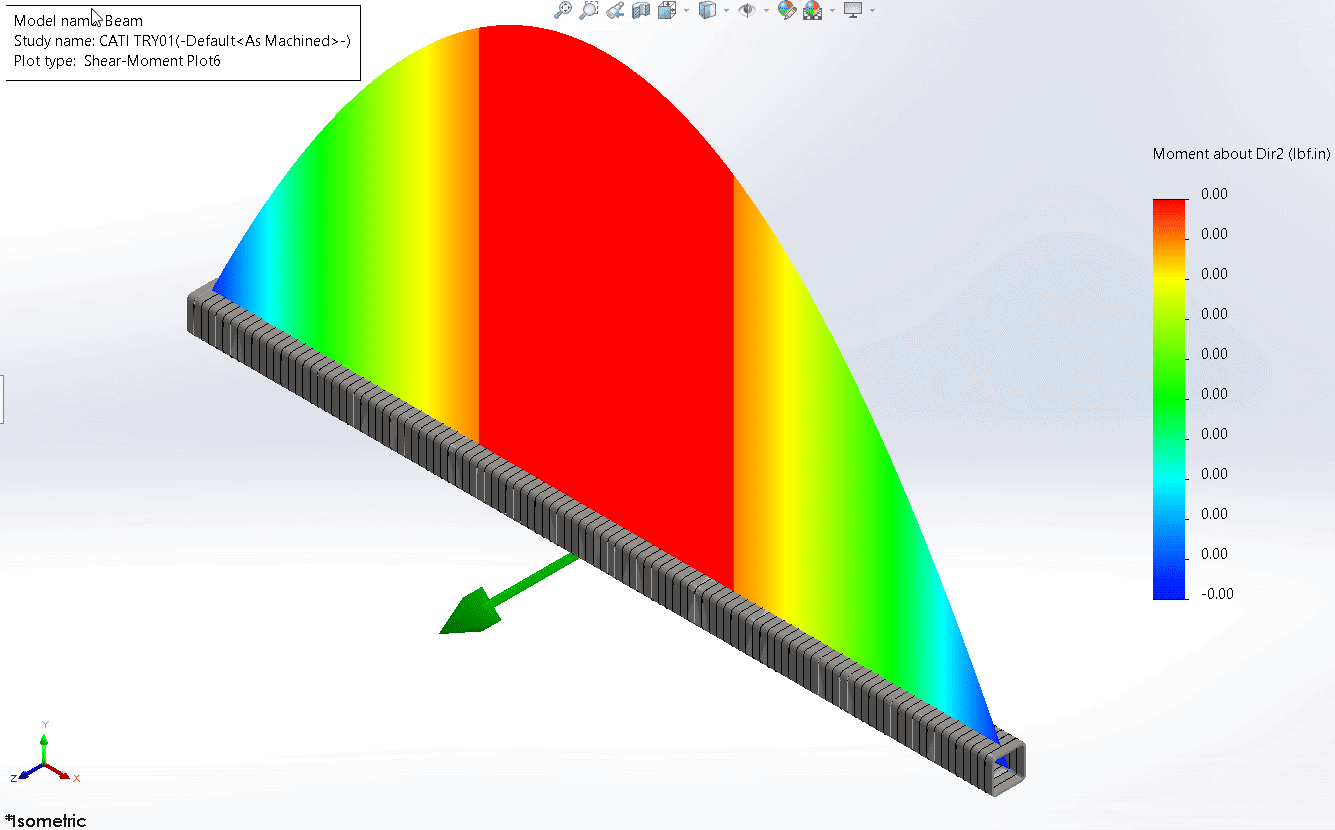
The graph of bending moment about direction 2 is shown below. This one is now self-explanatory. Ignore the shape because the values are all zero.
The plot of torque is shown below:
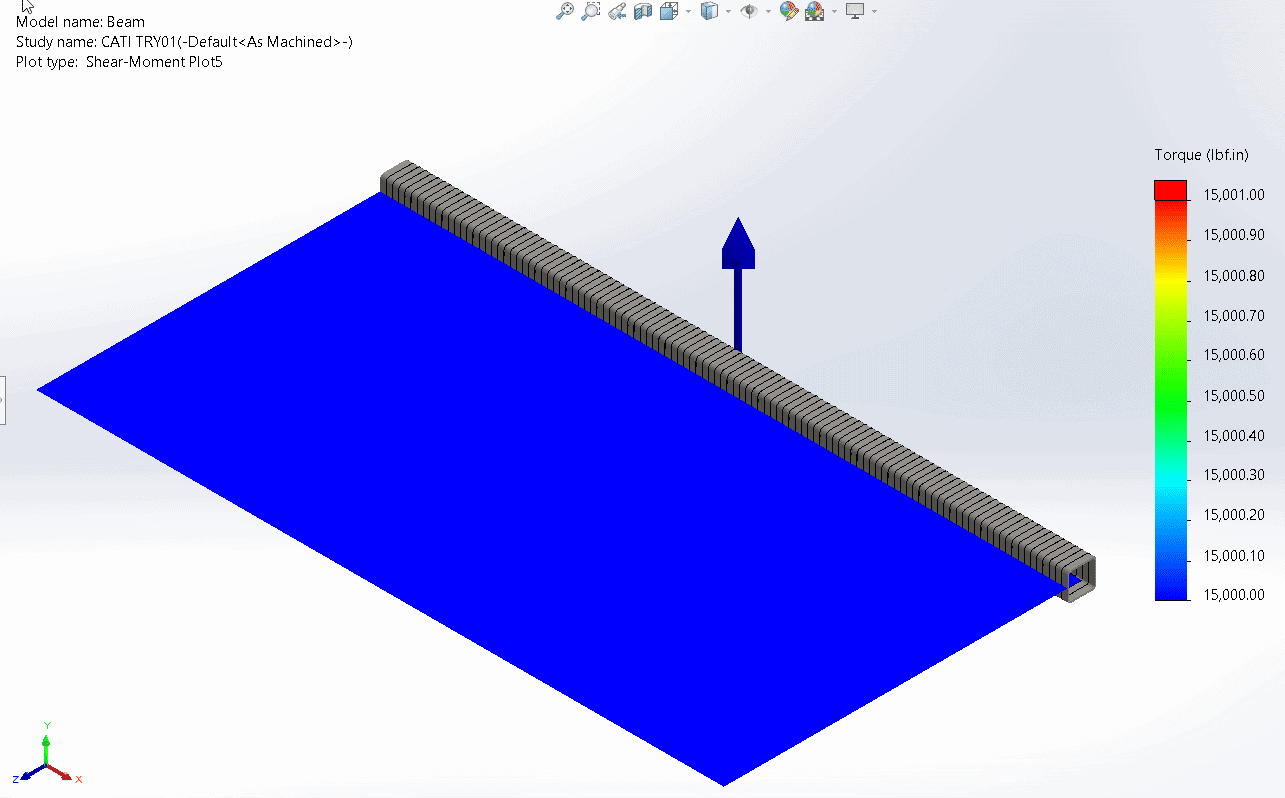
Our torque was applied to the right end in a clockwise direction. Using the right-hand rule, this results in a positive torque relative to the red axis of the local beam triad, as indicated in the plot.
Beam diagrams can be a very helpful way for us to understand the distribution of forces, moments and torque on beams in our FEA model. I wish I had this tool at my disposal when I was trying to pass my engineering courses in college. I would have aced the test! That said, pay careful attention to the orientation of your local beam triad, otherwise graphs of interest will be plotted on unexpected planes and the result will look confusing.
Now go design some innovative weldment structures with the help of SOLIDWORKS Simulation.
Alon Finkelstein
Simulation Product Specialist
Computer Aided Technology