Utilize SOLIDWORKS Simulation Color Options to Find Errors Quickly
Utilize Simulation Color Options to Find Errors Quickly
SOLIDWORKS Simulation allows engineers to simulate their designs prior to physical prototyping and helps engineers understand whether a part will fail or not. One of the common questions I receive from users of SOLIDWORKS Simulation is “how do I identify if my part is failing or not, and how do I identify problem areas in my part?” In this blog I am going to show three tips on how you can color code your plots to identify failures and problem areas much more efficiently in SOLIDWORKS Simulation.
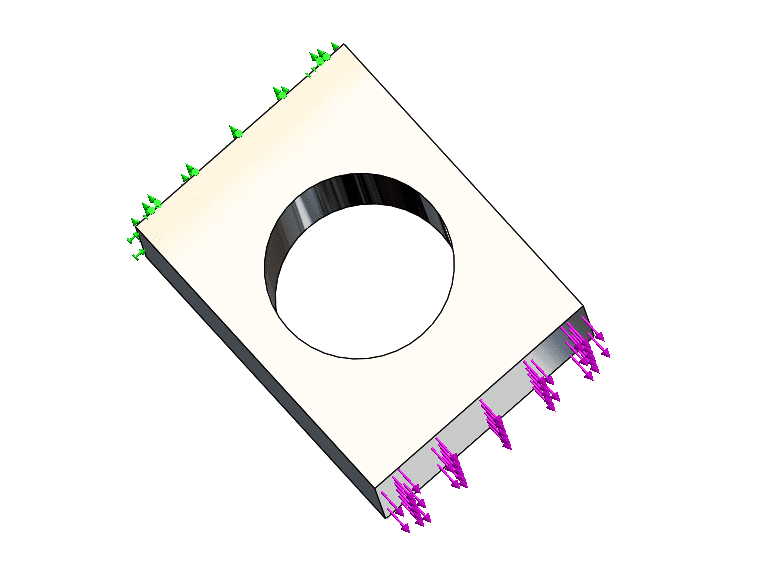
The part we are going to look at in this blog is a Plain Carbon Steel plate, with a thru hole in the center of the plate. The plate is fixed on one face (green arrows), and a tensile load of 115,000 lbf (pink arrows) is applied on the opposing face.
Tip Number 1: Turn on Max and Minimum Annotations
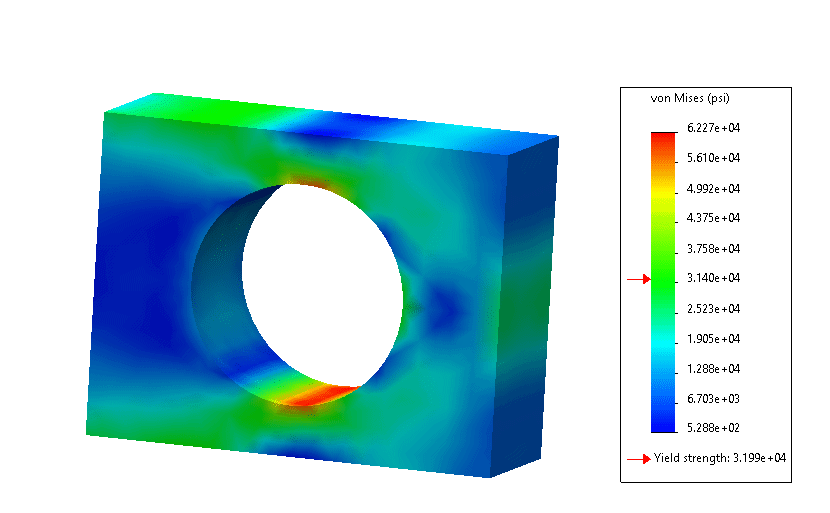
Once the analysis finishes, SOLIDWORKS Simulation provides three defaults plots (Von Mises Stress, Resultant Displacement, and Equivalent Strain). In this blog we will look at the Von Mises Stress plot. However, it should be noted, that all tips shown in this blog are applicable to the other types of plots. Looking at the stress plot, we see that the plot shows an overall gradient, where red areas indicate high stress and blue areas show lower stress. However, the plot does not explicitly show us where the maximum stress location is. Therefore, we need to turn on the maximum and minimum annotations on the stress plot.
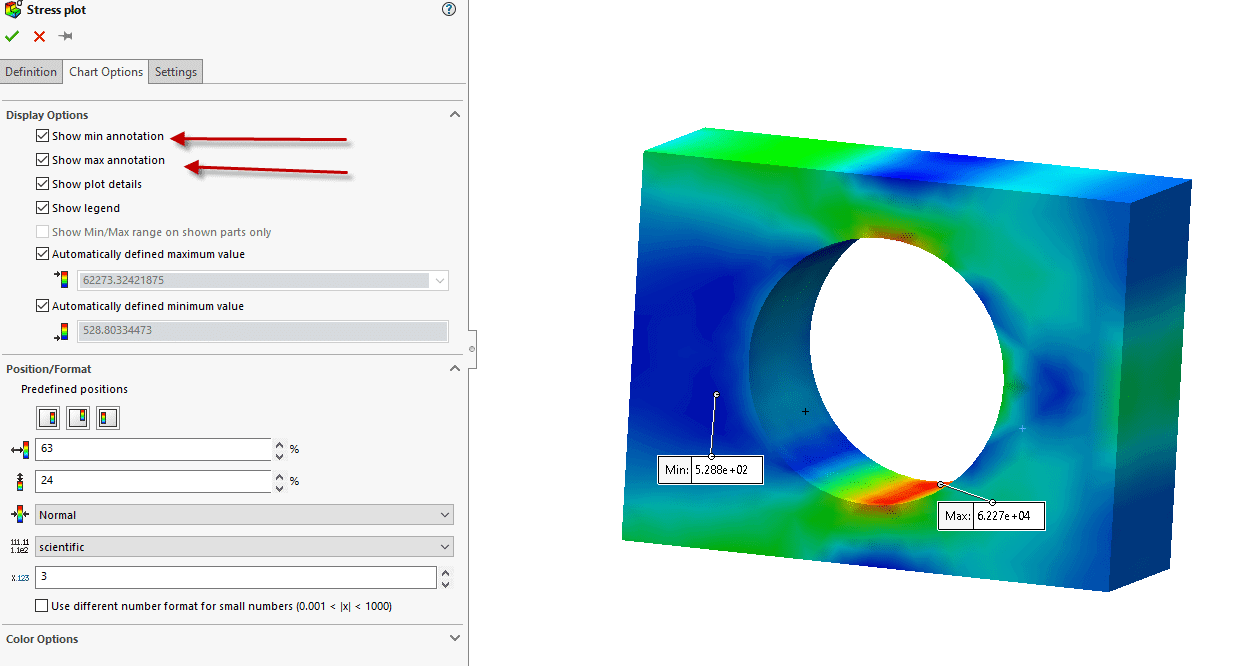
The first step in turning on the maximum and minimum stress annotations is to right click on our stress plot and then click on the chart options selection. This will take us to the chart options screen where we can then check and uncheck the maximum and minimum annotation boxes. When we do this, the plot will show us where the maximum and minimum stress locations are located. In this case we can clearly see that the maximum stress is located on the inside face of the through hole. Note, if you want to have your stress plots always show the max and minimum annotations for future models, go to Simulation Options> Default Options> Plot and then check the maximum and minimum annotations check boxes.
Tip Number 2: Adjust the automatically Defined Max and Minimum Values
One of the great things you can do with your color-coded legends is adjust the maximum and minimum values to be a contrasting color. By changing the legend to a contrasting color, it makes it very easy to identify high or low stresses in your model. To adjust the maximum and minimum colors, you first need to right click on the stress plot and select chart options. Next, you uncheck the automatically defined maximum or minimum value and manually key in the stress value. In our case, we will change our maximum stress value to right above yield at 32000 psi, and the color we pick will be black. Thus, any black color on the stress plot will show where we have a stress value above yield.
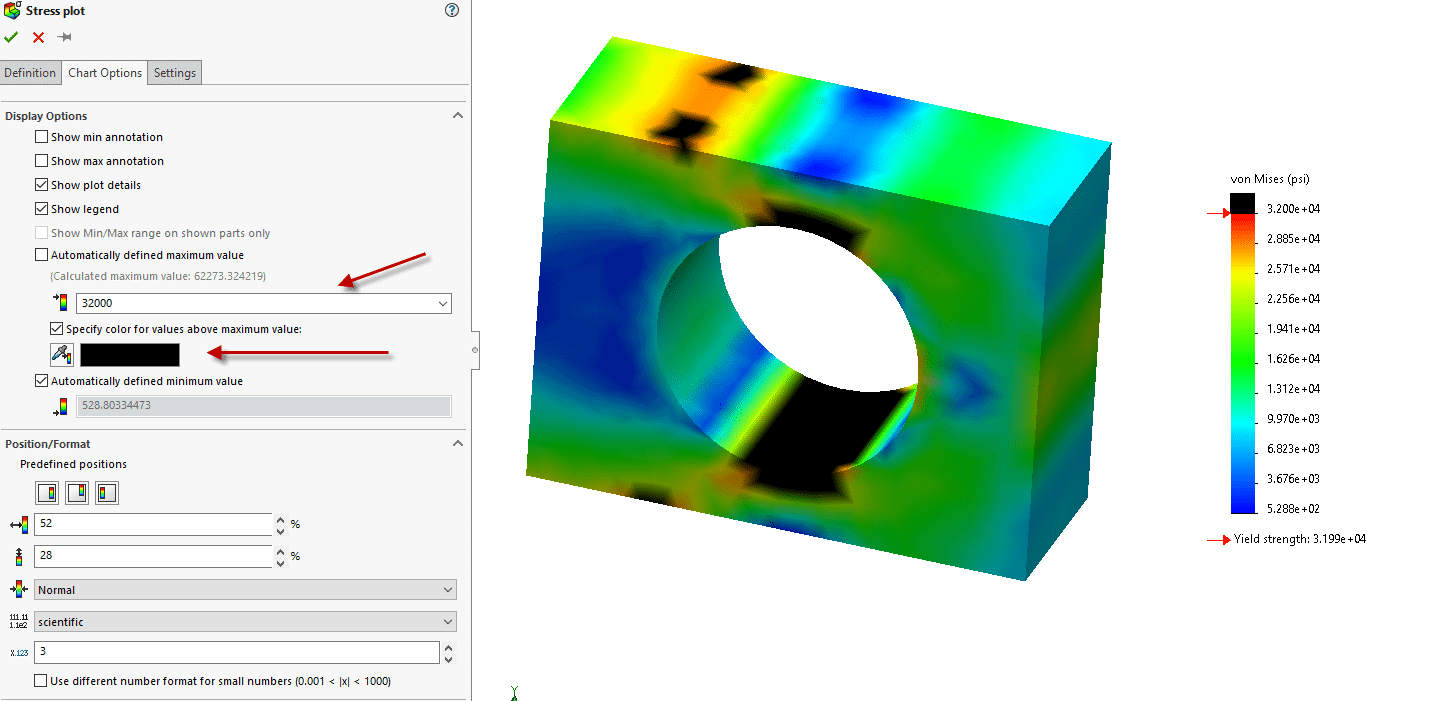
By adjusting the legend, we can see that multiple regions are above the yield stress, and it is not just the inner circle like we initially thought. The limitation of this method is if a part is colored black it could be at 32,000 psi or greater. Therefore, if you look at a black colored region, the stress value could be much higher than 32,000 psi. Tip 3 will overcome this limitation.
Tip Number 3: Adjust the Color Options for Yield Stress
SOLIDWORKS Simulation also provides users an automatic way of being able to specify values above yield. Note this method will only work on systems where there is either a single part, or an assembly where all parts have the same material properties. If you have an assembly with different material properties, the legend in stress plots will not show the yield strength. However, you can utilize the methodology in Tip 2 of this blog to color code the charts to identify critical stresses for multiple material properties.
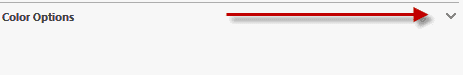
In this case we only have a single part, so we can utilize this technique to adjust the color properties. Very similar to tips 1 and 2, you need to right click on the stress plot and click on chart options. After going to chart options, move your mouse cursor to the bottom of the chart options window and click on the color options arrow.
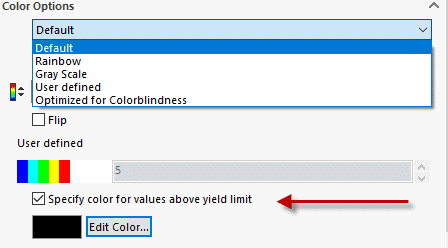
The color options window will give you multiple options to change the color coding of the chart. Users can change the overall gradient of the legend of the chart to a variety of predefined color gradients. Note, this is where you can change the gradients of stress plots to be optimized for color blindness. In our case we do not want to change the color options, we only want the chart to show above yield stress. Thus, we will hit the checkbox to ‘Specify color for values above yield limit’ and specify black.
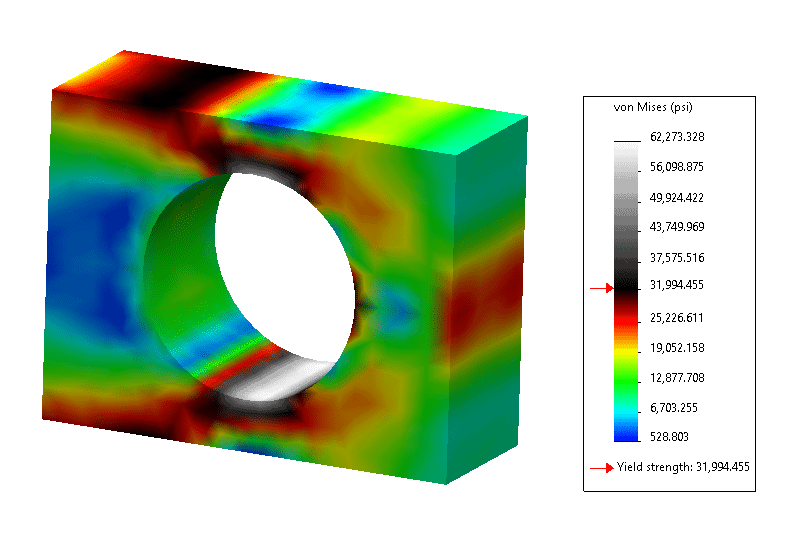
The stress plot will look a little different than the plot in Tip 2, in that SOLIDWORKS Simulation will provide a gradient that shows how much greater an area is than yield strength. If we look at our plot we see it matches what the plot looks like in Tip 2, but now it shows that the highest stress location is at the center of the hole, which correlates with the results of Tip 1. Thus, with this option the user can clearly see how much greater a location is than the yield stress.
Conclusion
Color coding options can help users quickly determine critical stress and displacement locations in SOLIDWORKS Simulation analyses. Using a combination of these three tips will help you understand how your part is performing in an analysis scenario. If you have any further questions about SOLIDWORKS Simulation, please reach out to us to see how you can streamline your design processes.
Drew Buchanan
Application Engineer, Simulation Specialist
Computer Aided Technology, Inc.
Drew Buchanan earned a BS in Mechanical Engineering from the University of Pittsburgh, and an MS in Mechanical Engineering from Villanova University. He has been working with Computer-Aided Engineering (CAE) tools since the early-2000s when he was an engineering co-op with Siemens Power Generation. Upon graduation, Drew worked in the Energy industry for six years working as a design and analysis engineer for design and analysis applications. He joined CATI in 2015.