SOLIDWORKS: Flow Simulation’s New Transient Explorer
Flow Simulation’s New Transient Explorer
For Flow Simulation, the SP0 release of SOLIDWORKS 2017 includes great new functionality to post-process your results from time-dependent analyses. The new tool is called the Transient Explorer. We couldn’t include this in our series of articles on the topic of “SOLIDWORKS 2017 What’s New” since this function wasn’t available in the prerelease version, but I think you’ll find that it is worth the wait!
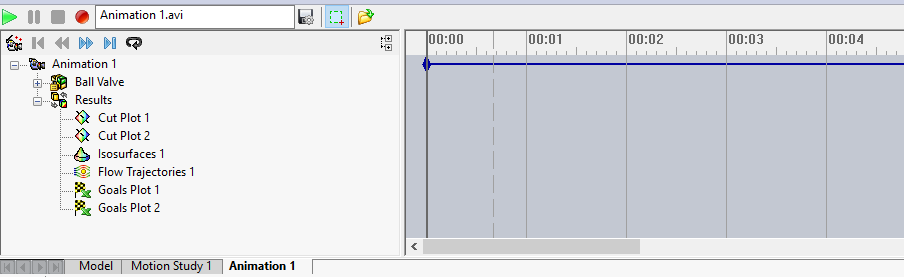
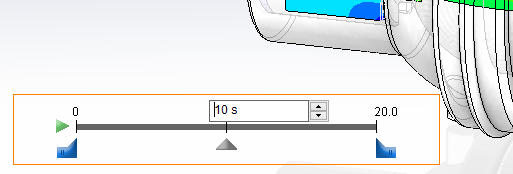
In prior releases, animation of time-dependent results required the use of Flow’s animation interface, which works like the SOLIDWORKS animation tool but is a bit tricky to set up.
Here’s a look at the Flow animation timeline prior to SW2017 SP0:
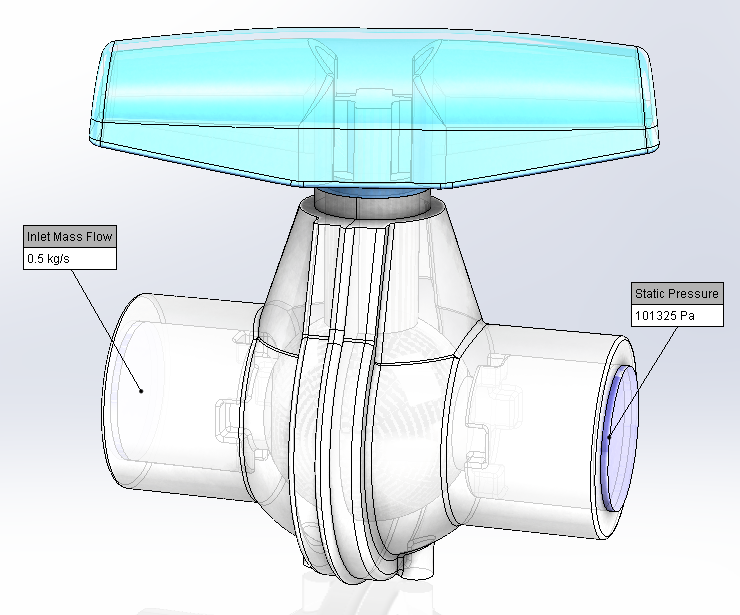
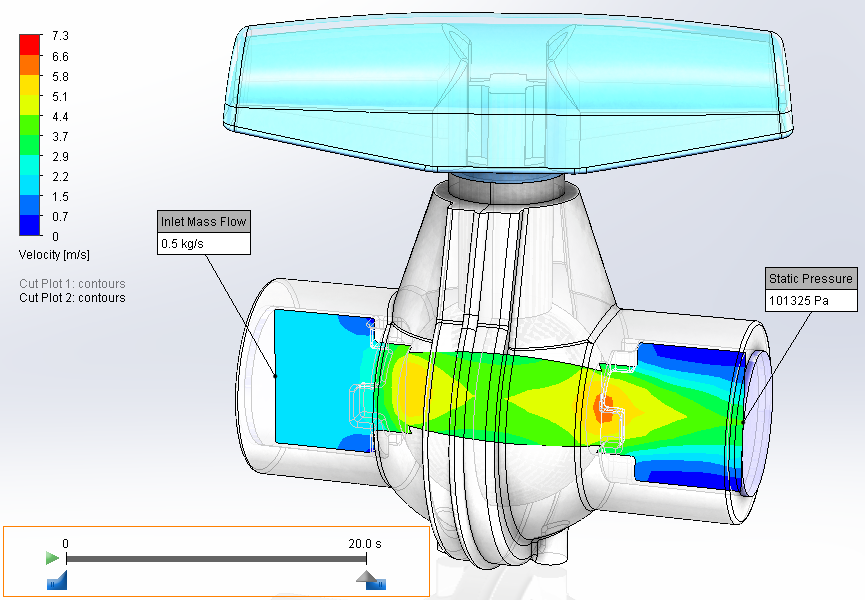
With Transient Explorer, animation requires only a couple steps during preprocessing, which I’ll demonstrate using the ubiquitous Ball Valve data set. This internal flow project was set up with a simple inlet mass flow of water at 0.5 kg/s and static atmospheric pressure at the exit.
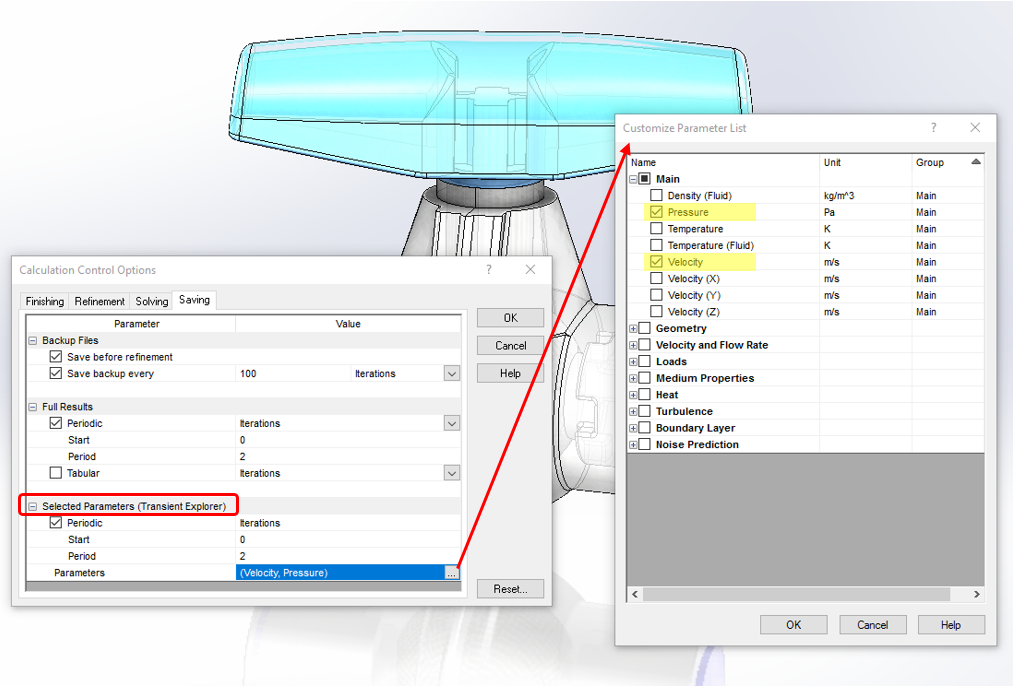
After setting up the time-dependent project using a total solution time of 20 seconds, the Transient Explorer setup is made via the Calculation Control Options window under the “Saving” tab. Here we’ve selected the pressure and velocity parameters to be saved every 2 iterations for subsequent display as a transient result.
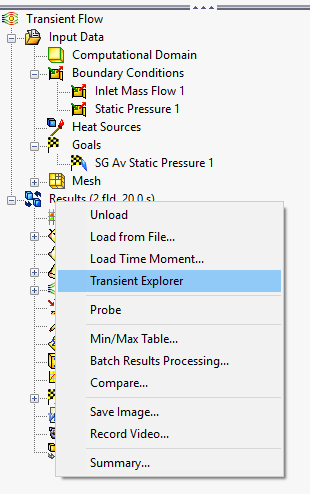
After the project is solved and results loaded, we can turn on the Transient Explorer via right-click on the Results folder, or from the Flow Sim Command Manager, and generate a result plot for any of the parameters we’ve previously designated.
Notice the new widget in the lower part of the image below? This is the Transient Explorer controller, allowing you to easily interrogate the results at any point within the transient solution directly from the graphics area, eliminating the need to access the Flow timeline. Here we see the velocity on a cut plot through the middle of the valve at the 10-second mark of the solution.

The slider can be moved to any desired solution time by simply dragging it within the widget. For precise control, we can pick the current time displayed above the bar and type in a new value. This technique can also be used to change either end of the displayed range.
Here is the plot for the 20-second mark.
Finally, animation of the results across the time range is easily done by picking the green “play” arrow at the left end.
This addition to an already great simulation product will increase efficiency and ease of use when working with time-dependent results in SOLIDWORKS Flow Simulation. Give it a try, I think you’ll agree!
Kurt Kurtin
Technical Manager
Computer Aided Technology