SOLIDWORKS Simulation: Maximum Recommended Time Step for a Transient Thermal Analysis
Have you ever run a transient thermal analysis using the thermal analysis tool SOLIDWORKS Simulation Professional and wondered what the correct time step or time increment value to use? You may also have wondered what total time should you use too for your thermal transient analysis? Well hopefully after reading this blog you will have a better understanding of what to use for both the total time and the time Increment (step) for a transient thermal analysis.
Let’s first start with the theory and math behind it all per SOLIDWORKS knowledge-based article number S-059741. The recommended time step size Δt for a transient thermal analysis is related to element conduction length and the material properties you use on your components. Element conduction length is defined as the element length for line elements and for plane or volume elements it’s the diagonal of the inscribed circle or sphere. Material properties consist of including the conductivity, mass density, and specific heat of the material you choose for your thermal study.
The larger the thermal diffusivity, the smaller the Δt and the element length should be. The time step is given as:
Δt ≤ δ^2 / 4α
where:
δ = conducting length (m)
α = thermal diffusivity = K / ρ c (units of length^2 / time) or (m^2 / sec)
K = conductivity (W / m^3)
ρ = mass density (kg / m^3)
c = specific heat (J / kg K)
Now that you understand the theory and math behind it all, lets now see an example of how this would be used in SOLIDWORKS Simulation software. Let’s start with just a cylindrical rod made of glass. See Figures 1 and 2 below.
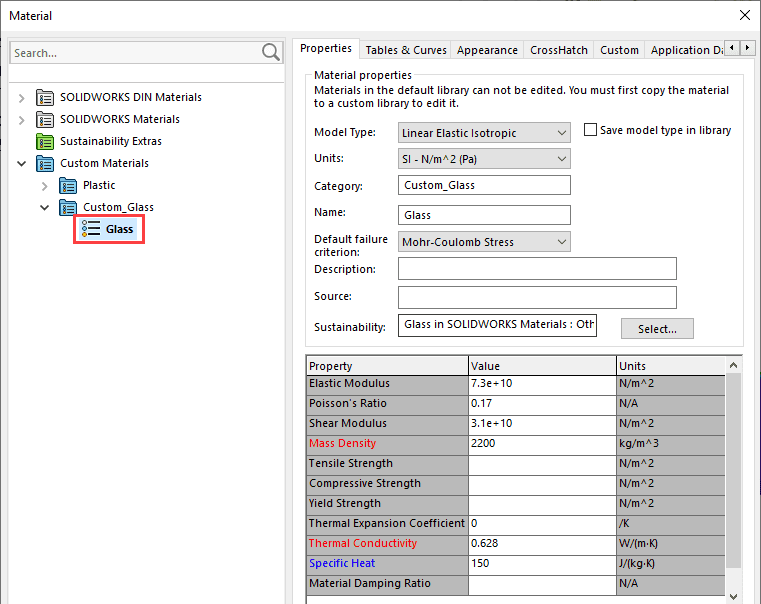
Fig. 1 Glass material property info
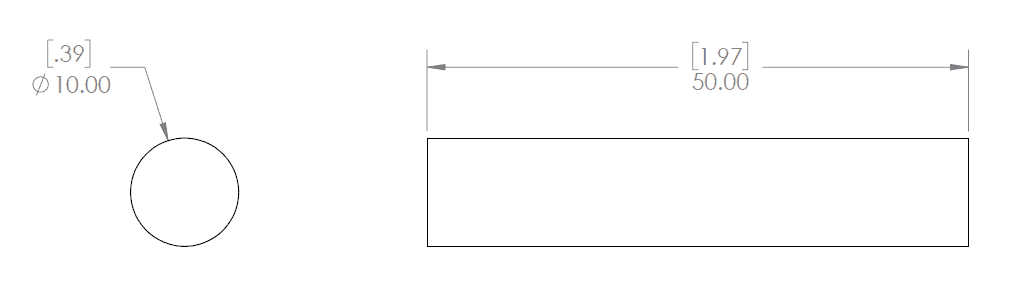
Fig. 2 Dimensions of rod
From there we will activate the Thermal Analysis tool and set up our pre-processing steps for both the steady state and transient analysis studies. See Figure 3 through 5 below.
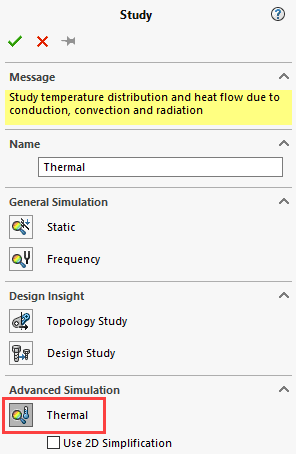
Fig. 3A Thermal analysis study and options to set up
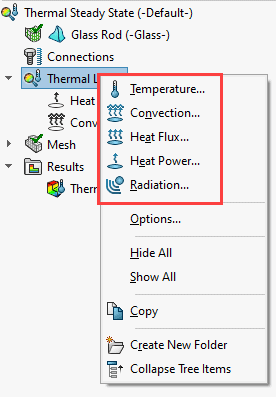
Fig. 3B Thermal analysis study and options to set up
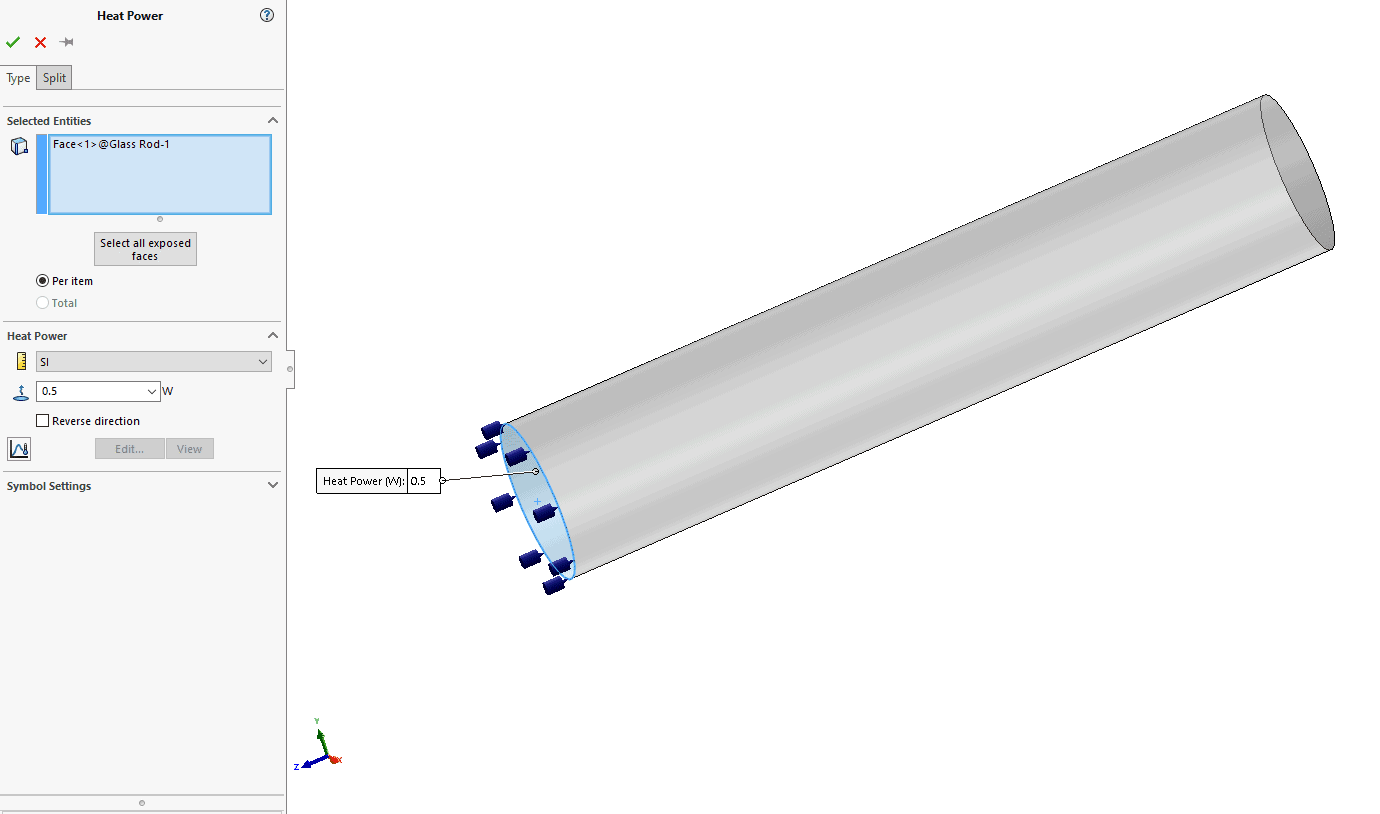
Fig. 4 Heat Power settings for steady state and transient studies
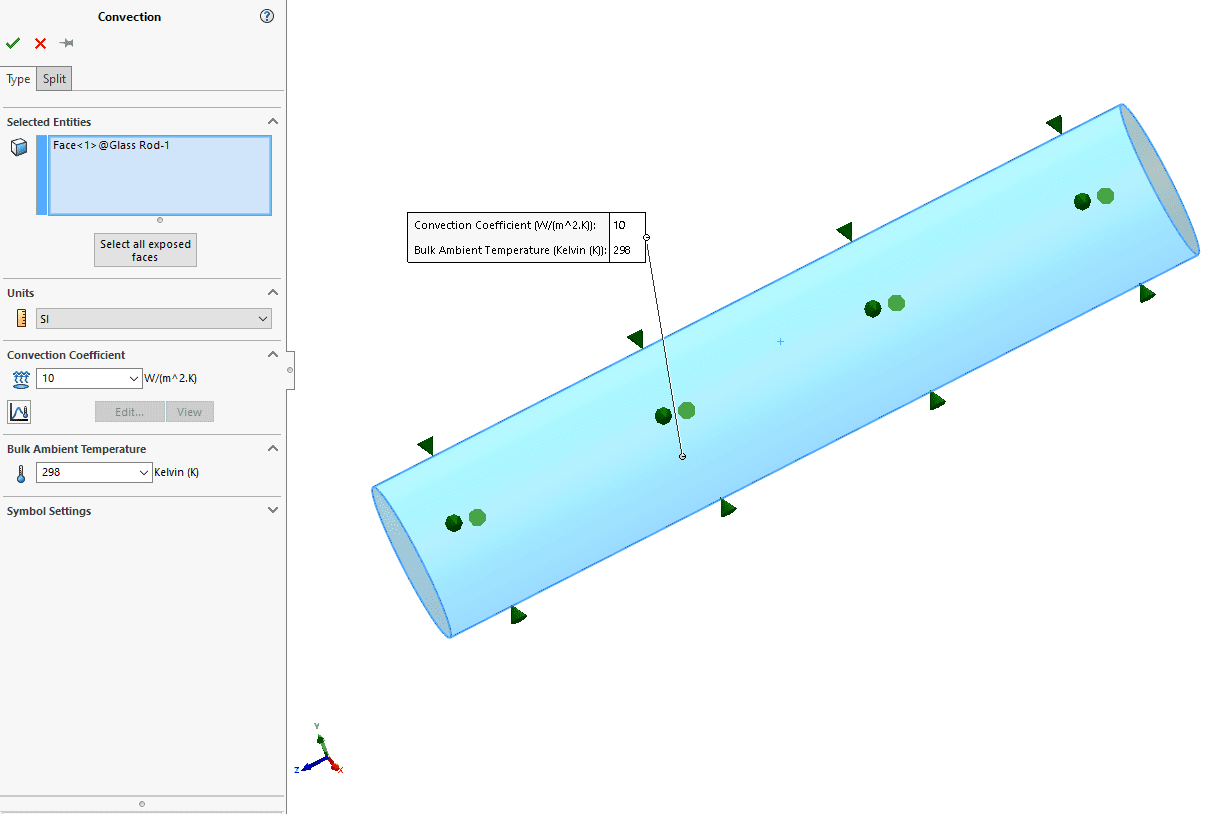
Fig. 5 Convection settings for steady state and transient studies
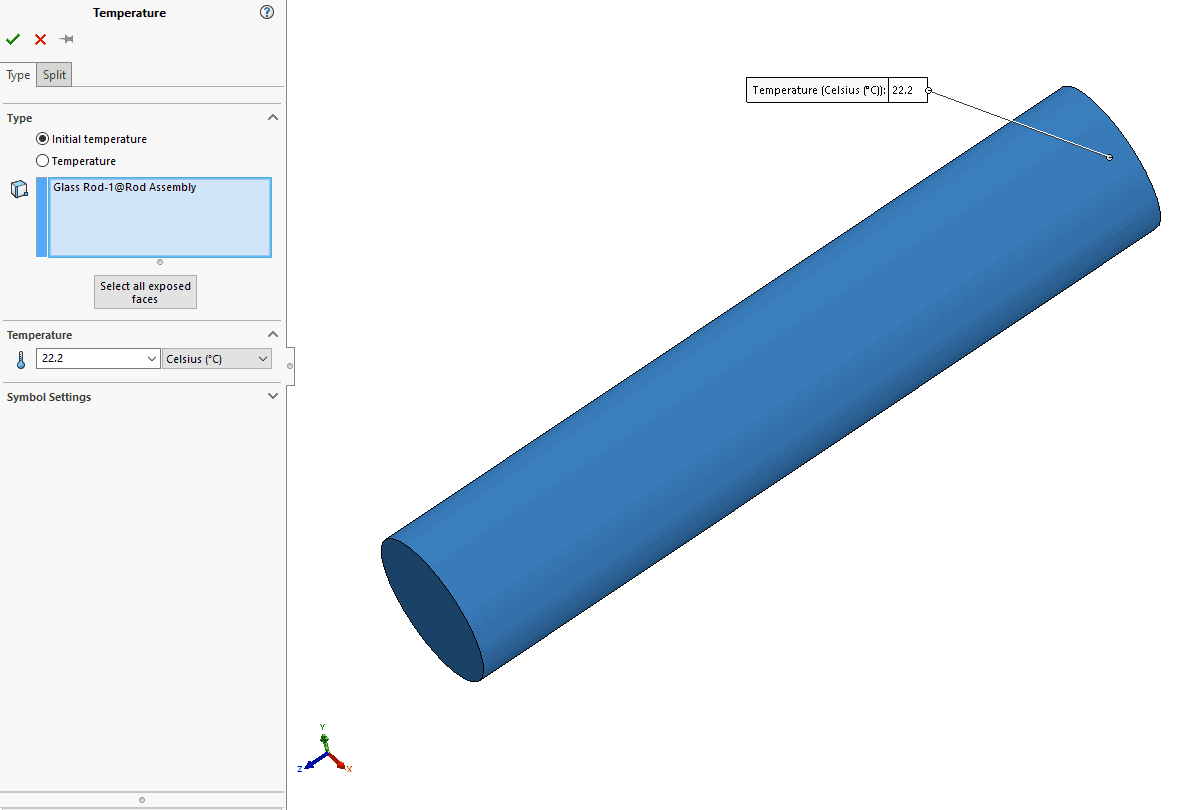
Fig. 6 Temperature settings for transient studies only
Now that we know the setup for each analysis type lets cover next where in the thermal study you go to activate a steady state or transient analysis. Also, where you go to set the time step and time increment values discussed earlier.
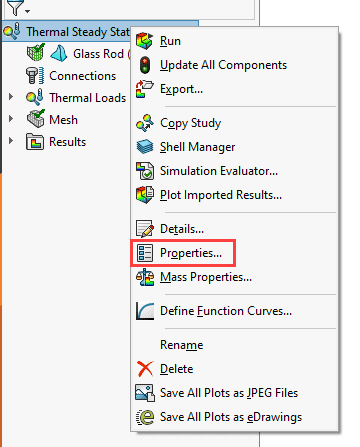
Fig. 7A Thermal study properties
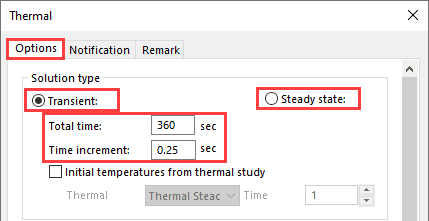
Fig. 7B Thermal study properties
Next will run the steady state analysis to get insight on what maximum temperature we are needing to for our transient analysis studies. Note, the Standard Mesher was used with a Global mesh size of 2 mm. As you can see in Figure 8 below, the maximum temperature we need to use is 155.97 degrees Celsius.
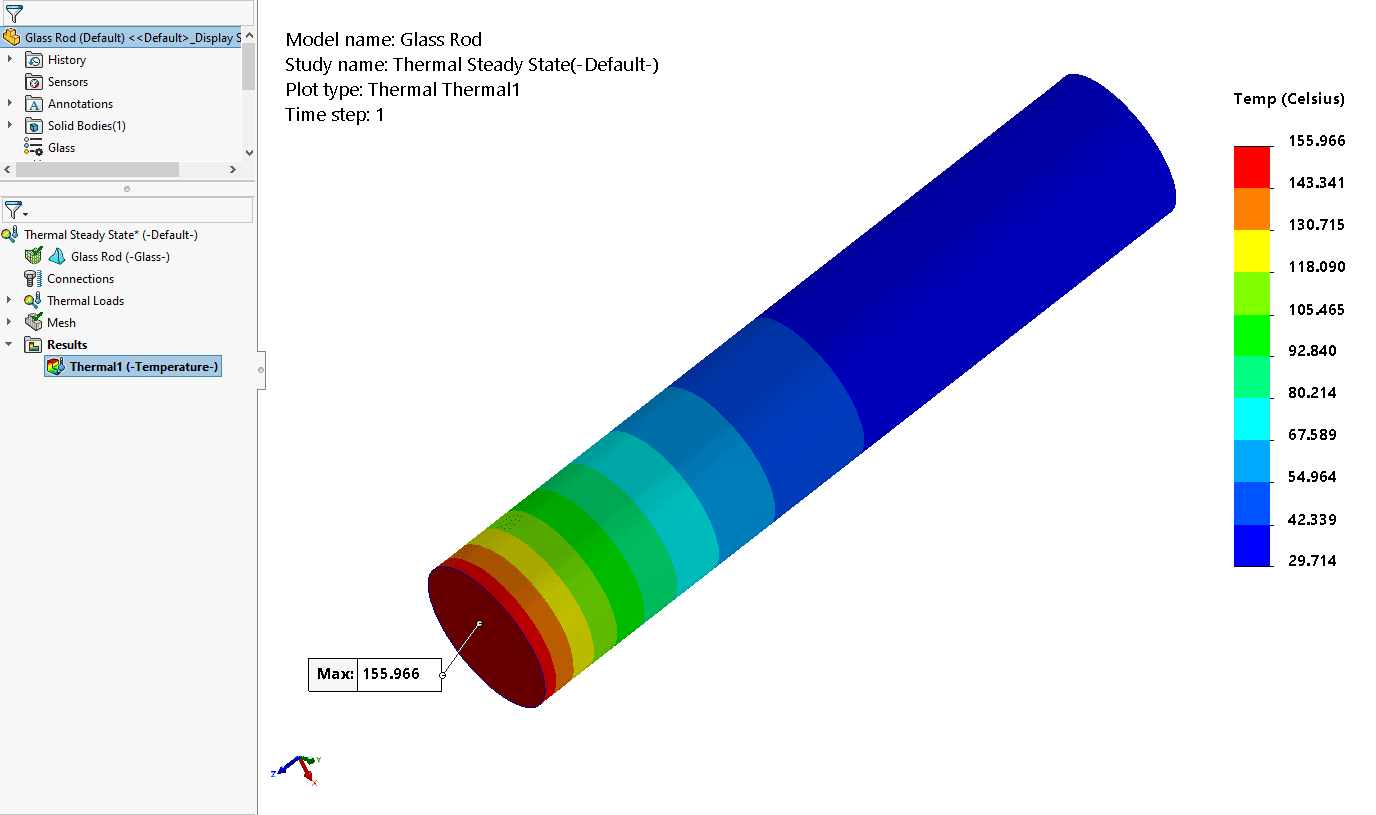
Fig. 8 Steady State results
Next will run a few transient studies at certain total time and time increment values to prove the time step equation discussed earlier. To do this we need to use the Probe tool for each study to show first that the study has converged on a maximum temperature value and to pick a point in the middle of the solution to see how the movement of heat was developing. See Figures 9 and 10 below.
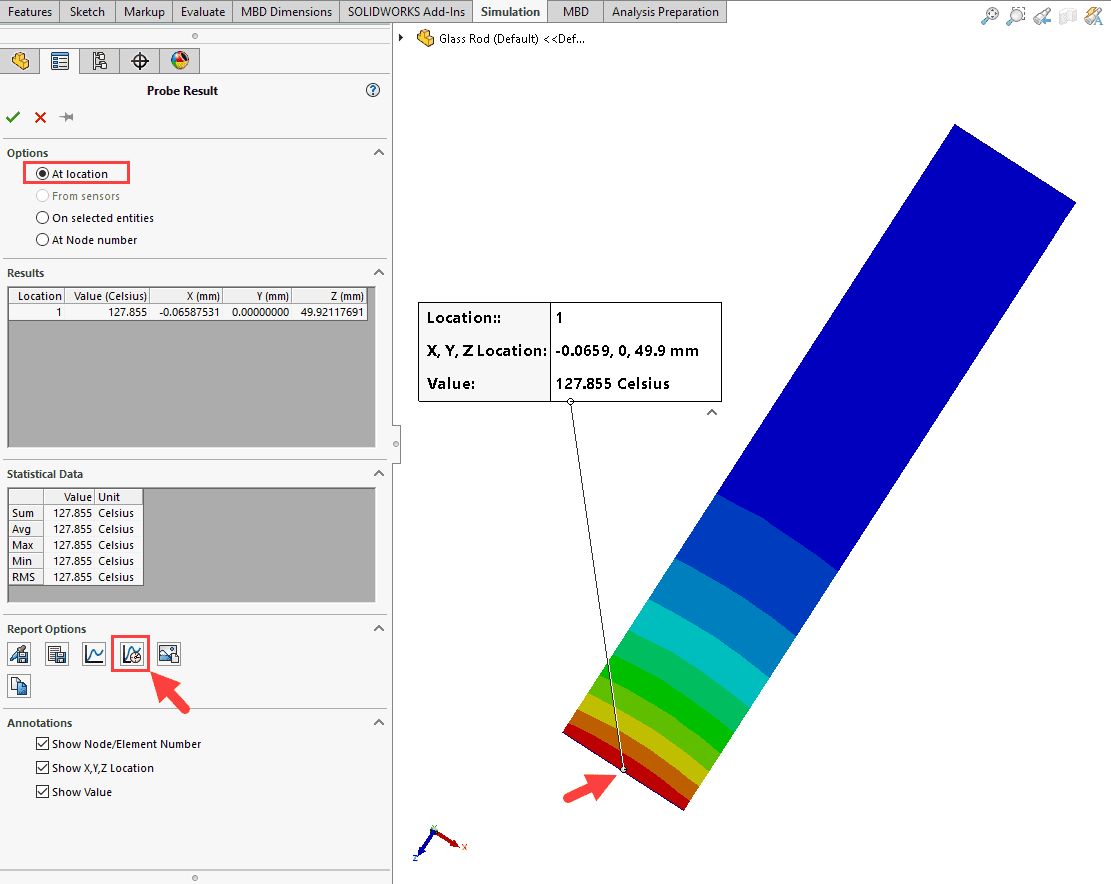
Fig. 9 Probe tool result at location
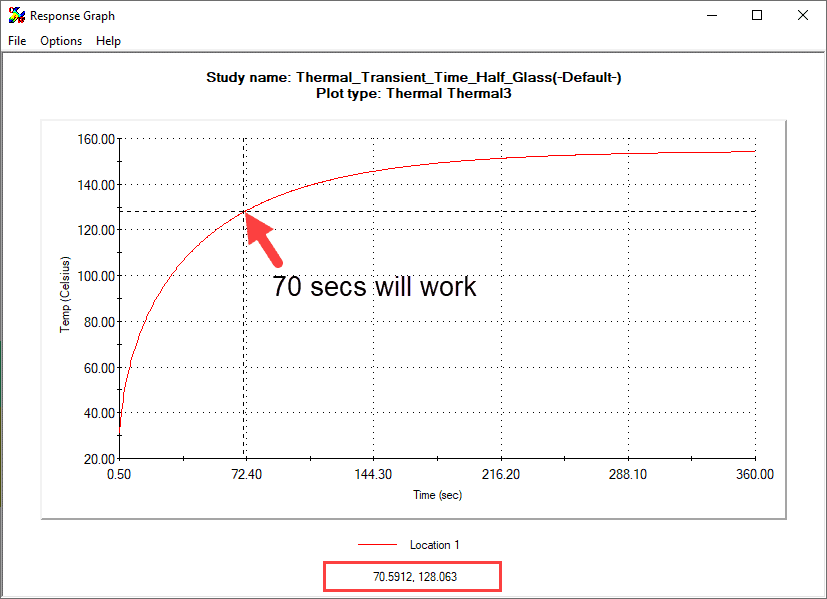
Fig. 10 Response plot graph
Create a new Thermal Plot for each transient study to view the Plot Step Time at 70 seconds. I went ahead and created a chart showing the different results you would get for each study type. See Figures 11 and 12 below.
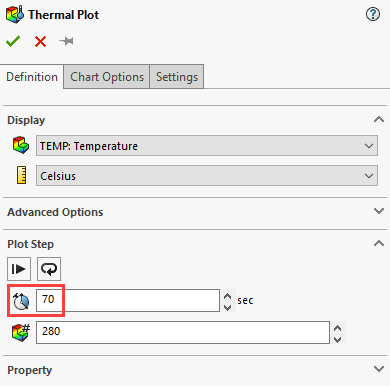
Fig. 11 Thermal Plot settings
|
Total Time (secs) |
Time Increment (secs) |
Max Temp (C) |
Temp (C) @ 70 secs |
|
|
Steady State Study |
N/A | N/A | 155.966 | N/A |
|
Transient Study 1 |
360 | 0.25 | 155.426 | 128.745 |
|
Transient Study 2 |
360 | 0.50 | 155.422 | 128.674 |
|
Transient Study 3 |
360 | 1.00 | 155.414 |
128.532 |
| Transient Study 4 | 360 | 2.00 | 155.399 |
128.248 |
Fig. 12 Results from each study type
Yes, the temperature values at 70 seconds do not change for such a simple model but remember the recommended time step size Δt were to use is to be less than or equal to the conductivity length squared divided by four times the thermal diffusivity. For transient studies one and two our time increment values are within range and the temperatures at 70 seconds are not changing as much as they are in transient studies 3 and 4.
I hope you found this blog useful and plan to use the recommended time step size equation for your next thermal analysis run on your own designs.
Nick Pusateri
Senior Application Engineer Specialist, Simulation
Computer Aided Technology