Understanding Contact Hierarchy in SOLIDWORKS Simulation
In SOLIDWORKS Simulation, contacts are crucial to the performance of assemblies. It can be said that in SOLIDWORKS Simulation there exists a rule of three. Three types of mesh, three types of global contact, three levels of contact, and so on. The purpose of this blog is to make sense of the hierarchy of contact in SOLIDWORKS Simulation.
Anyone who has taken training or used SOLIDWORKS Simulation extensively knows that 3 “levels” of contact exist: Local, Component, and Global. The training manual explains it as below:
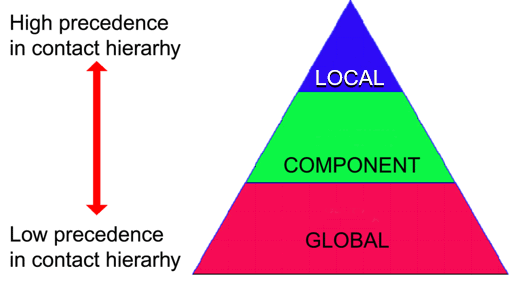
(Credit SOLIDWORKS Simulation training manual 2018)
Essentially, any type of local contact on a face, edge or vertex overrides any other type of contact. A component level contact overrides a global level contact; and a global level contact overrides none but is applied as default between all touching faces (usually bonded).
When I teach SIMULATION, I have a simple model that I use to demonstrate this principle. I figured it would be a good thing to share with the user base at large. Moving forward, I will be using the contact visualization plot to show the contacts that are being used in the simulation. To access this plot, right click the connections folder → contact visualization plot, or Simulation menu → Contact/Gaps → contact visualization plot.
Below is the simple multibody part I made for my demonstration. It has 3 bodies, with coincident touching faces. In the picture below, only the global [bonded] contact is applied.
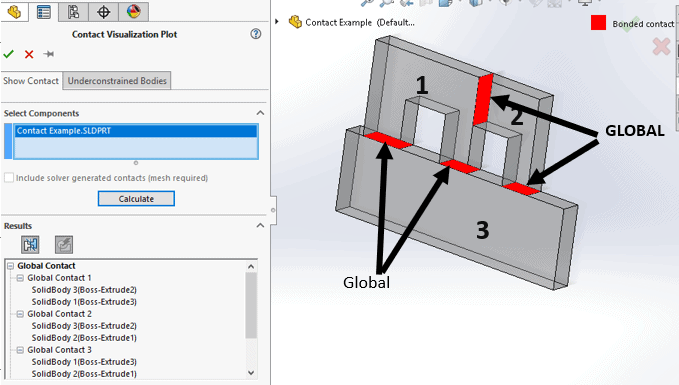
Notice that bodies 1, 2, and 3 are all bonded on every coincident face, shown red. Next, I will apply a component level contact (Allow Penetration) between bodies 1 and 3. This will result in just faces on those bodies having that condition, but the global contact maintained on the other faces. See below:
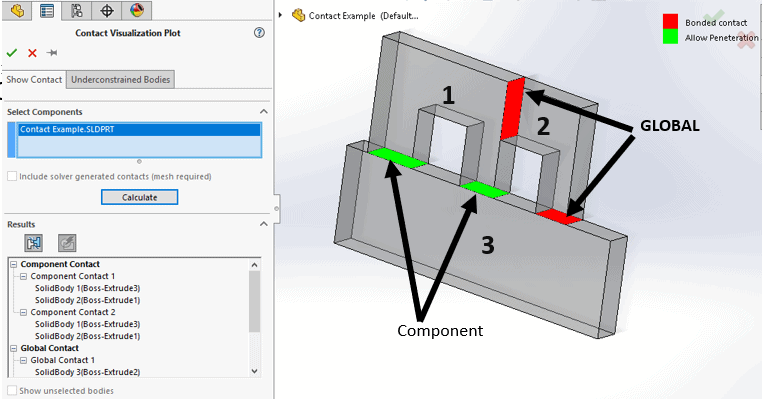
It can be seen that the component level contact (shown green) overrides the global on the two contacting faces. Lastly, I will add a local contact (no penetration) on one of the contacting faces between bodies 1 and 3. This will override both the component and global level contact on that face, but that face only.
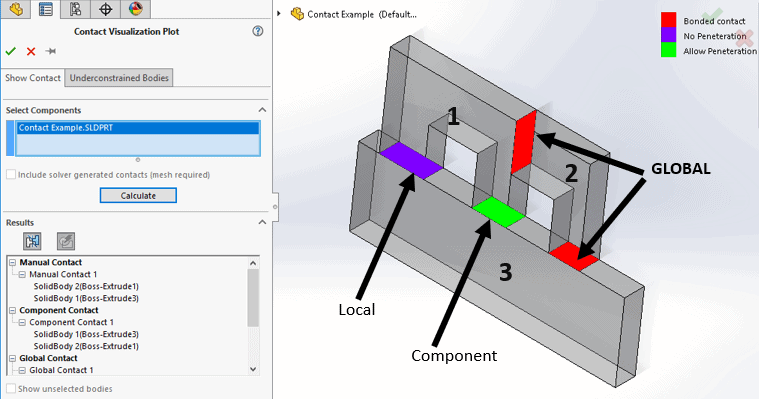
Notice that every contact from body 2 remains at the global level because there has been no local or component level contacts to override it. The two contacting faces between bodies 1 and 3 override the global contact with first a componenet level, and then a local contact on the leftmost face.
This is one of the best examples I have come up with that demonstrates the contact heirarchy that exists in SOLIDWORKS Simulation between local, component and global contact. Each level of contact has it’s place in the setup, and knowing which contacts are actaully being calculated can be the difference between a good result and an wasted analysis.
I highly recommend the use of the above mentioned contact visualization plot before running any assembly analysis; it can show not only defined contacts, but also the contacts the solver generates if you have a mesh already.
Until next time, thank you for taking the time to read this blog, for more great SOLIDWORKS Simulation blogs, stay at the CATI website.
Matthew Sherak
Applications Engineer, Simulation
Computer Aided Technology, Inc