How Do I Create My First SOLIDWORKS Flow Simulation Surface Plot?
If you want to learn how to load your Flow results and create your first cut plot check out the previous blog in the series “How do I View SOLIDWORKS Flow Simulation Results and Create My First Cut Plot?”
With your Flow Simulation setup and solved the next task is to view and inspect the results. One plot that provides insight into your design is the Surface Plot. The Surface plot allows the user to see what is happening at the surface of your geometry or at a specified offset.
The surface plot can show the Pressure profile created by the flow on the surface, Heat Flux, Heat Transfer Coefficient, Normal Forces etc.
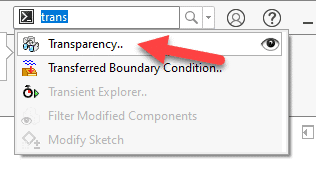
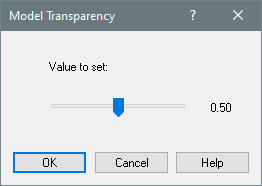
One option I like to use when creating a surface plot is the transparency option. Transparency behaves differently when the Flow Add-In is turned on. Going to the command prompt at the top of the screen type transparency. You will see that the command gives you one slider that adjusts the entire model’s transparency.
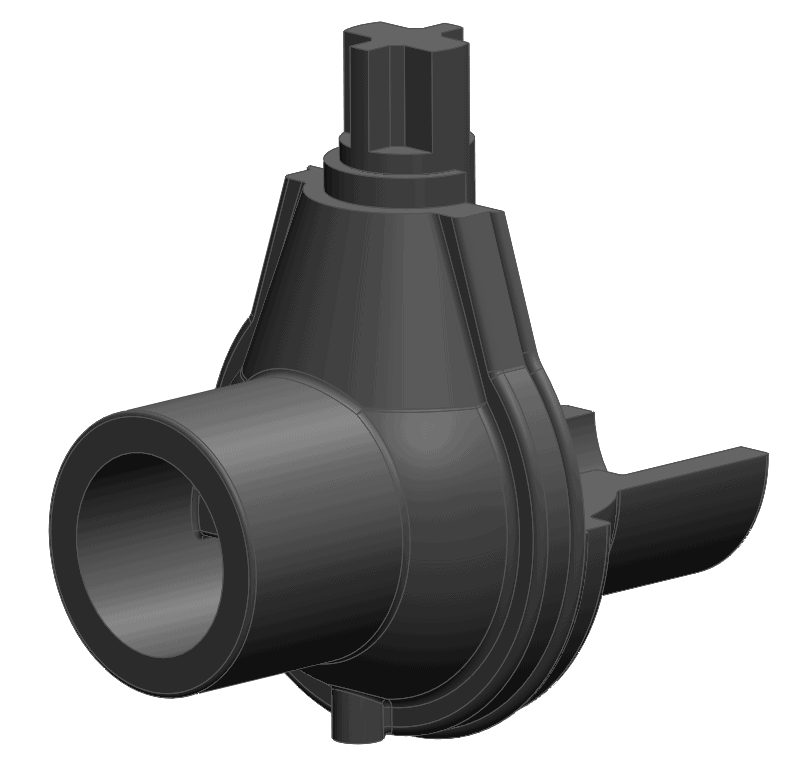
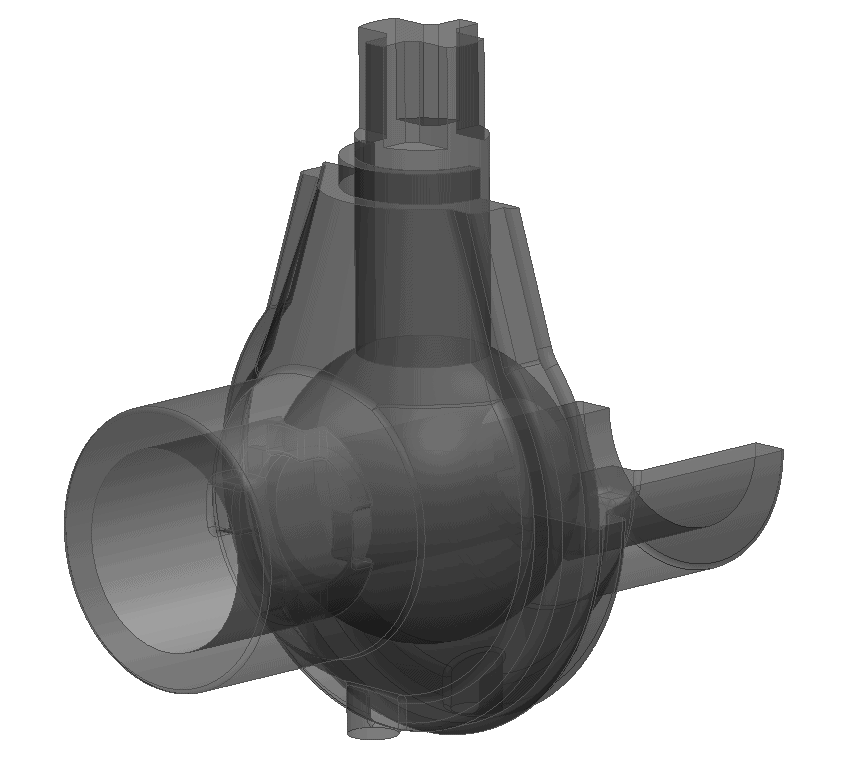
Transparency makes viewing the surface plot easier.
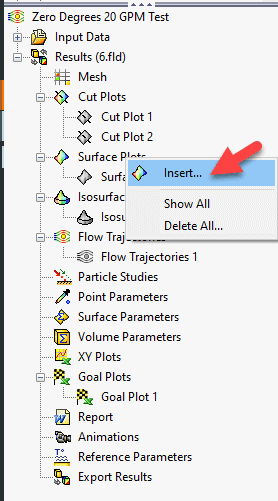
Now, on the Flow Manager Tree right click on the Surface Plot folder.
Select the faces that you want to see the plot represented on.
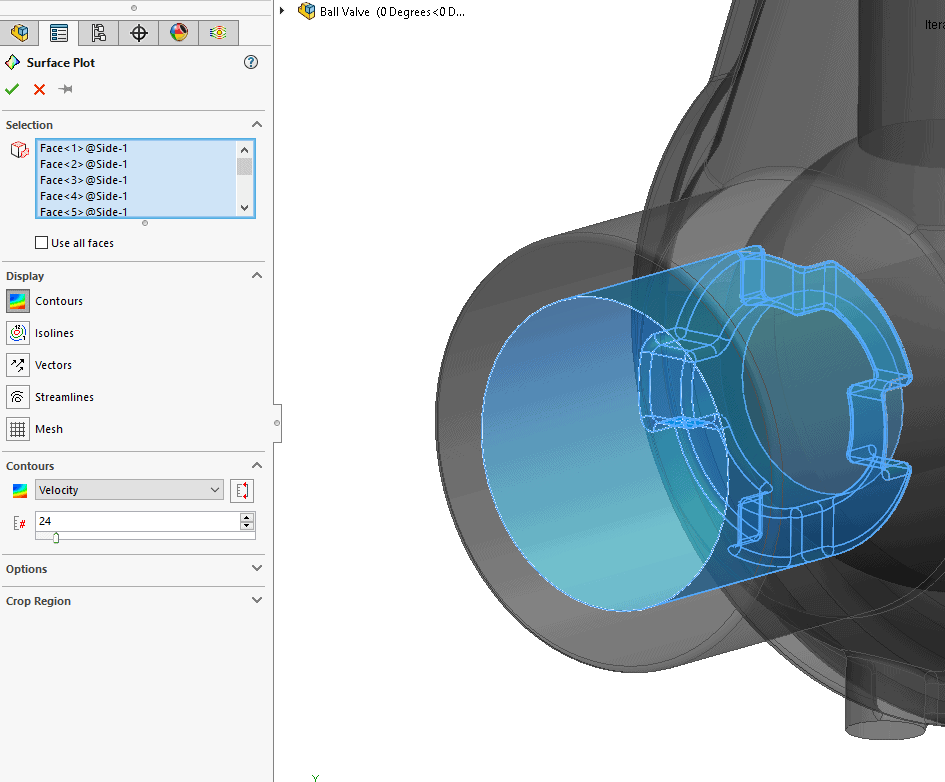
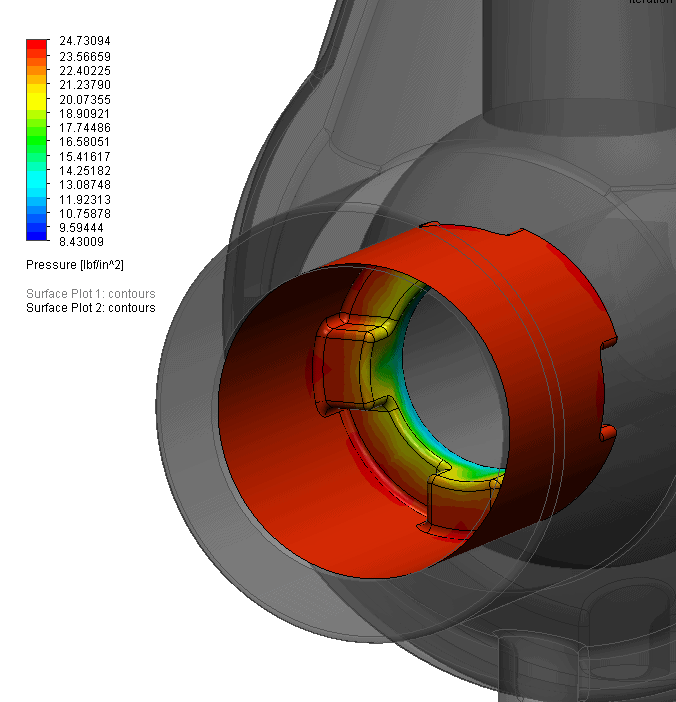
Select the parameter you wish to examine. In this case I chose pressure. You can select contours, vectors, streamlines etc.
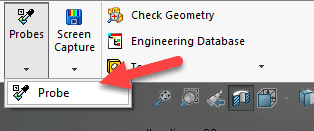
Choosing the probe tool allows you to verify pressure live on the plot.
Loading Flow Simulation results and generating your first surface plot is straight forward in SOLIDWORKS Flow Simulation. Try it out for yourself and customize the cut plot output to your specific preferences. There is no right or wrong way to create a surface plot.
This blog has an accompanying video under the same title. Check out the Computer Aided Technology video page for more information and subscribe.
Robert Warren
Simulation Specialist, Elite Application Engineer
Computer Aided Technology, Inc.