SOLIDWORKS Flow Simulation Add-on Module Benefits - HVAC Part 2
This is part 2 of a SOLIDWORKS Flow blog series. If you would like to read part 1 first, which I recommend, here is the link: SOLIDWORKS Flow Simulation Add-on Module Benefits – HVAC Part 1. The HVAC part 1 blog focused on solar absorption in transparent materials. Let’s focus on human comfort parameters for part 2.
The Setup
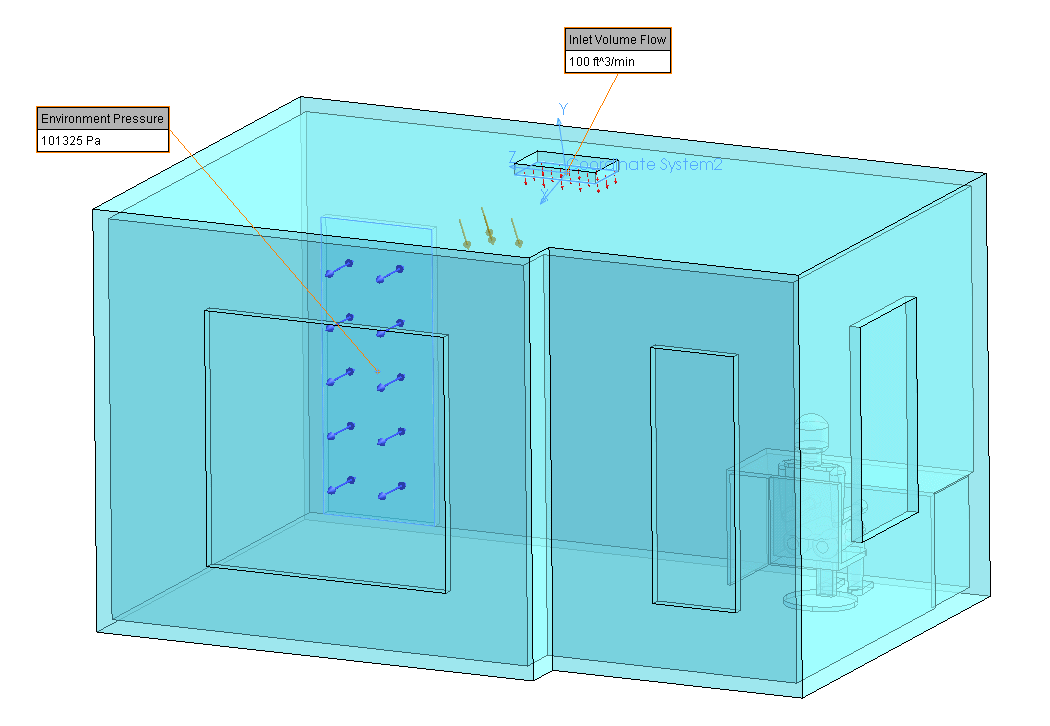
We use the same model from the part 1 blog with the addition of a simple desk and the figure of a human. We also use the same boundary conditions with the option for the transparent windows to absorb some of the incoming solar radiation.
Before we solve the study, we must make an additional change. In the image below, we have selected the option Calculate Comfort Parameters under the Solving tab of Calculation Control Options.
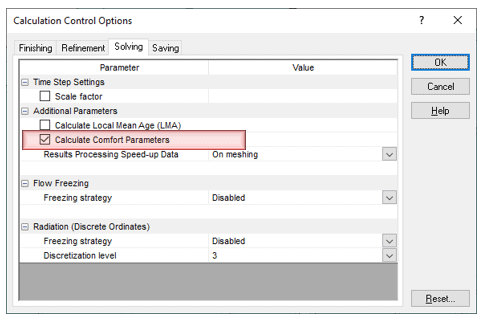
Note: To get into Calculation Control Options simply right click on the name of the project, found just above Input Data, and select Calculation Control Options on the pop-up list.
The Results
Once the solver finished, we created 3 cut plots; a Predicted Percentage Dissatisfied (PPD) plot through the center of the chair, a PPD plot through the center of the vent, and a Predicted Mean Vote (PMV) plot through the center of the chair.
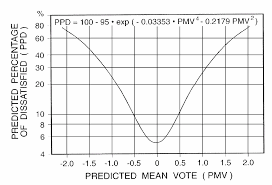
PPD and PMV are two different ways to represent the same data collected from individuals about their perceived comfort. The data can shift based on several factors of which we won’t discuss in this blog. With this in mind, I have provided an image, below, of a generic PPD versus PMV graph. A general rule for the acceptable range in PMV is between -1 (slightly cool) to +1 (slightly warm). This correlates to roughly 24% dissatisfaction (PPD).
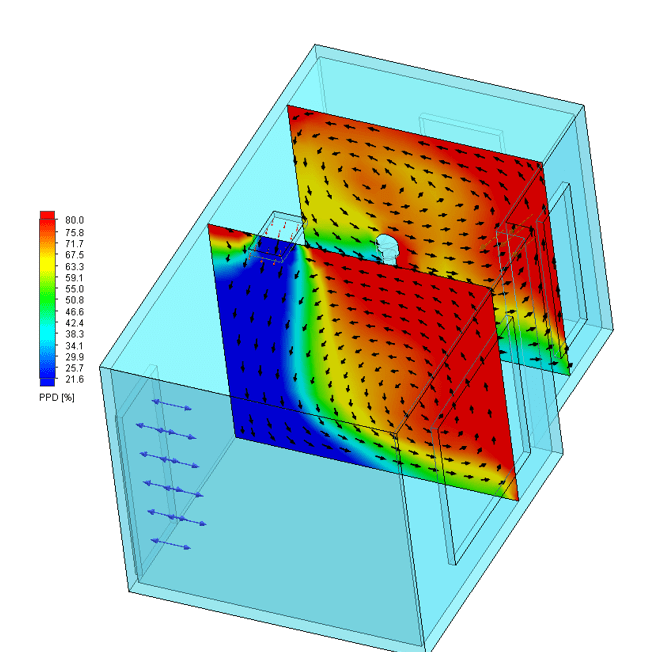
The plot below is of PPD at the location of the office chair. As you can see, the PPD significantly exceeds the acceptable range of 0 to 24%.
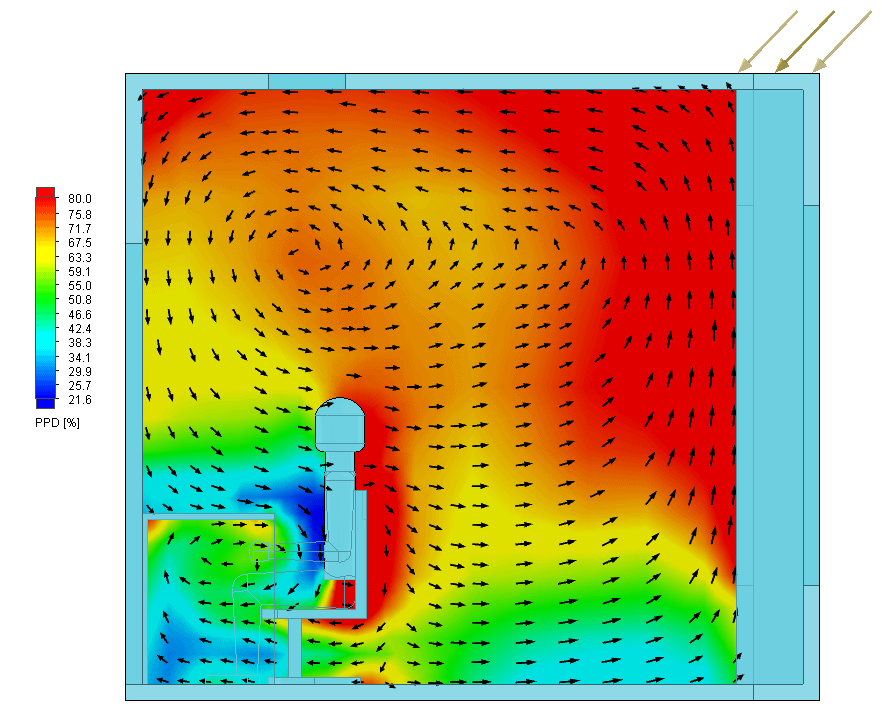
When shown as a PMV plot we can see that most of the area around the human is at a level of +2 (warm). The individual in this scenario would not be comfortable. 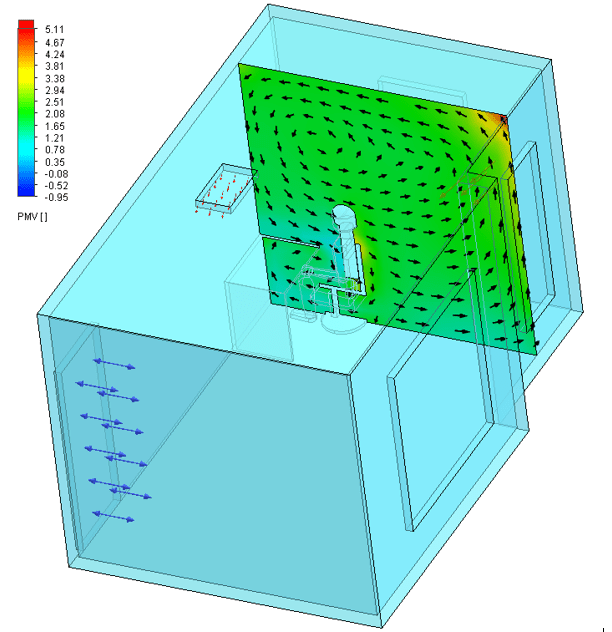
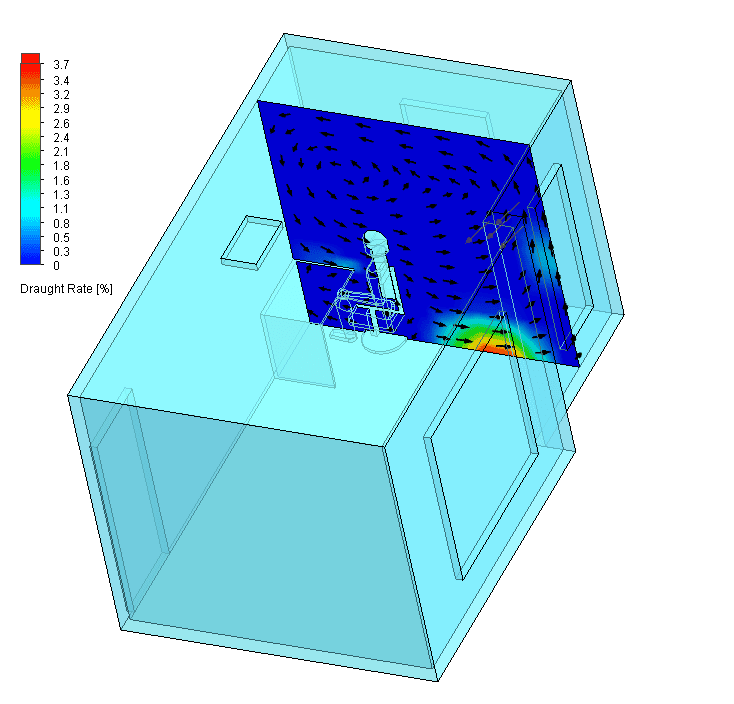
Let us assume for a moment that the PMV around the person was in the comfortable range (-1 to +1). In this scenario, we must also check for draught (English spelling of draft) because the air has a velocity component to it. A current of cool air near certain areas like the feet or neck could cause discomfort. I use the English spelling because the plot that we use in Flow Simulation is called Draught Rate, which is measured from 0 to 100%; ranging from nobody being uncomfortable (0%) to everybody being uncomfortable (100%).
I created a Draught Rate plot for this project for demonstration purposes. For the plot below, the Draught Rates ranges between 0 and 3.7% and so we can safely conclude that draught (draft) is not contributing to the overall discomfort of the individual. All of their discomfort derives from a room that is too hot.
What can be done to make this a more comfortable working environment?
Conclusion
When comparing the results in the center of the ceiling ventilation to the area of the desk we could conclude that sliding the desk underneath the vent could improve the comfort level. Another simple solution would be to add blinds and curtains to the windows. If this building is in design mode, then the changes could be much more significant and impactful. I strongly recommend running an HVAC study prior to construction.
Matthew Fetke
Application Engineer, Simulation
Computer Aided Technologies, LLC