Simulation Options
Simulation Options
Many users are not aware the SOLIDWORKS Simulation has its own set of options, they are located from the pull down menu under: Simulation, Options.
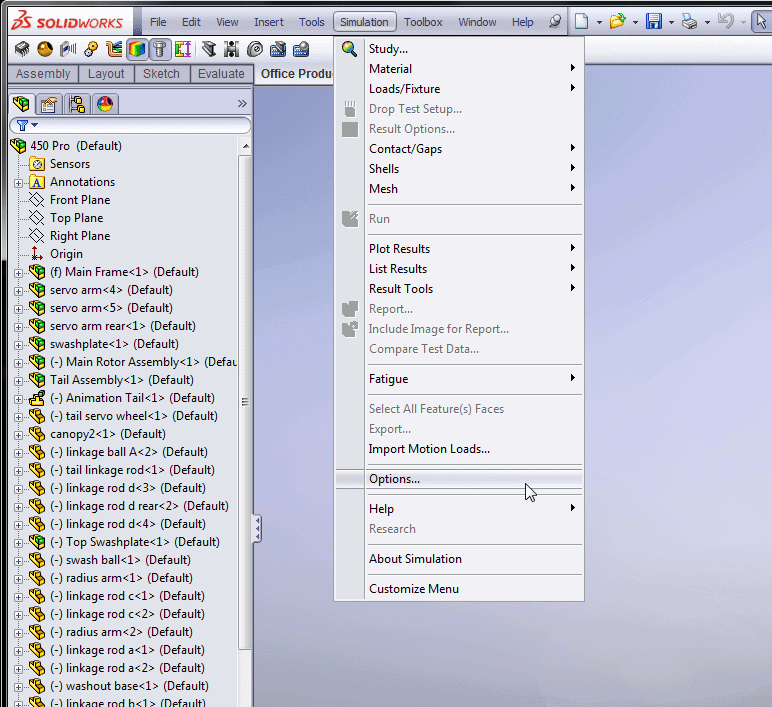
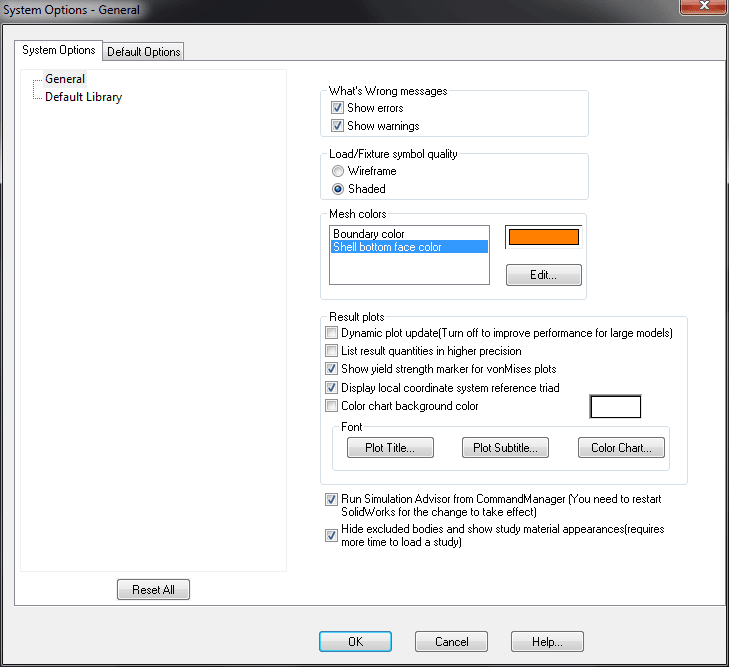
The options are split in two categories: System Options and Default options. The system options apply to all simulations studies; it contains setting for the display of error messages and the default library locations. The option that many users modify is turning off the Simulation Advisor.
The Default options apply to new studies and the ones you’ll want to become familiar with. Settings such as units, default plot types, plot scaling and plot colors. Think of these at the Document Property options in SolidWorks; they apply to the current simulation study. These are the settings that you may find yourself continually changing in every study.
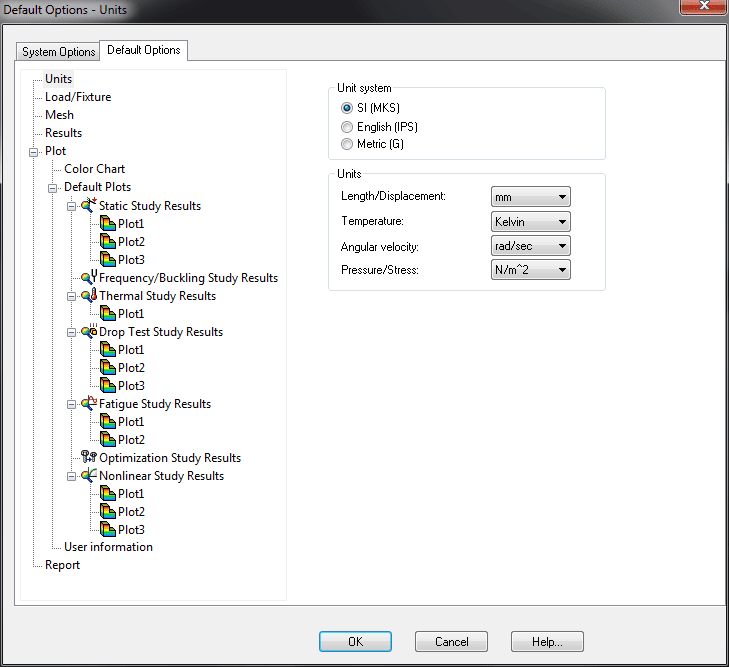
The first set of options is the Units. The settings themselves are self-explanatory and you’ll want to set them before you run a study, as they will not modify the units of existing result plots.
Load/Fixture options allow the user to make changes to the colors and size of all the Symbols that Simulation contains. There is also a setting to turn off the previews when loads, fixtures and mesh control.
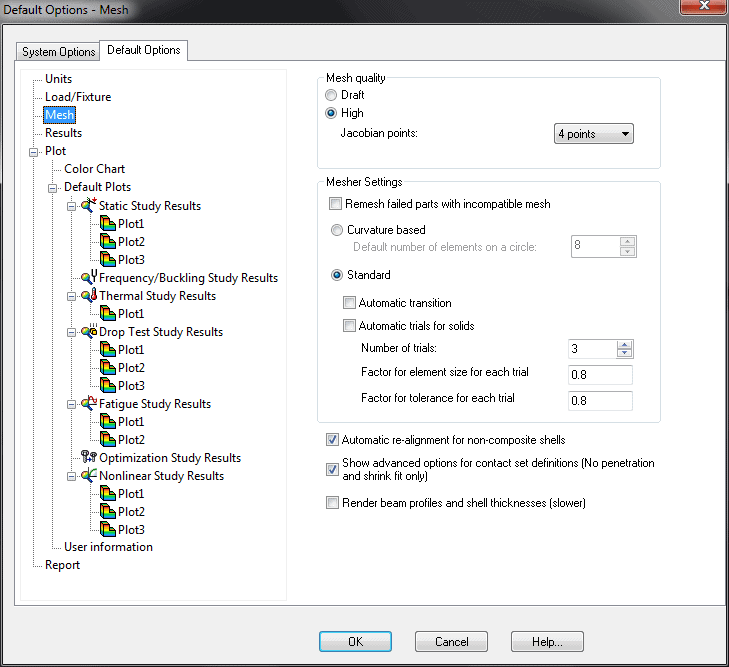
The Mesh options allow the user to change the default mesh from Curvature to Standard, High to Draft quality. There are other settings to change by typically the defaults are sufficient and these settings are changed more frequently in the individual study themselves.
The Results settings allow the user to change the default solver and the location of the results files. Unless you’re very familiar with the differences in the solvers and when to choose one over the other, it’s best to keep this set to Automatic.
The various Plot settings and the sub-categories are where you can really change the look at feel of the graphical plots Simulation creates. There are options to enable the mix and max annotation callouts and change the deformed shape scaling factor. Many users do not care for the graphical scaling factor, so this is where it can be shut off completely.
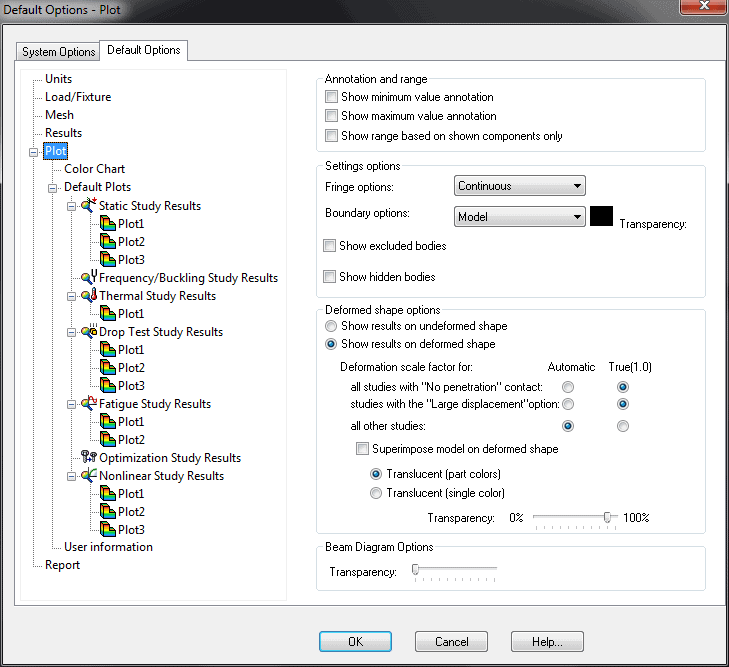
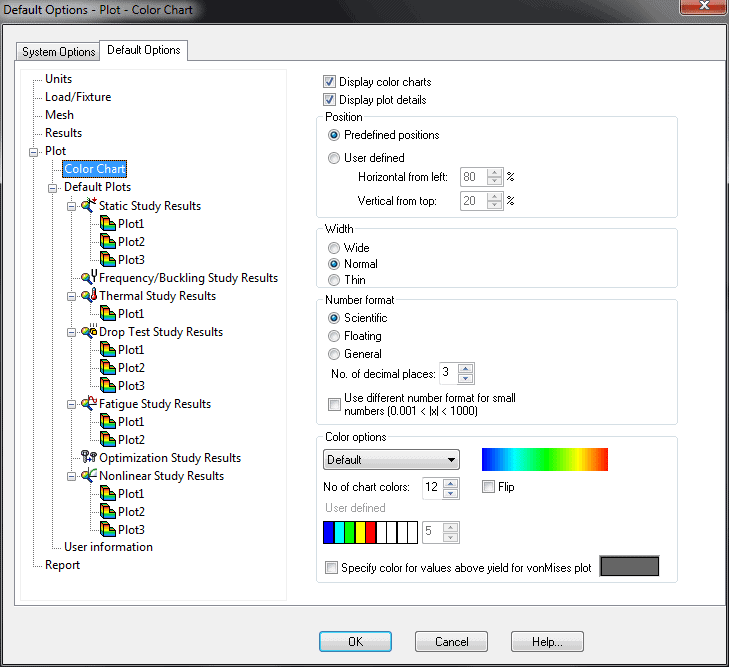
The color chart setting control the “rainbow” chart that’s displayed with most result plots. There are options to turn it off, change the number of colors, change its location in the graphics window, and adjust its width. Specifically, you can change how the numbers are being displayed and the number of decimal plates.
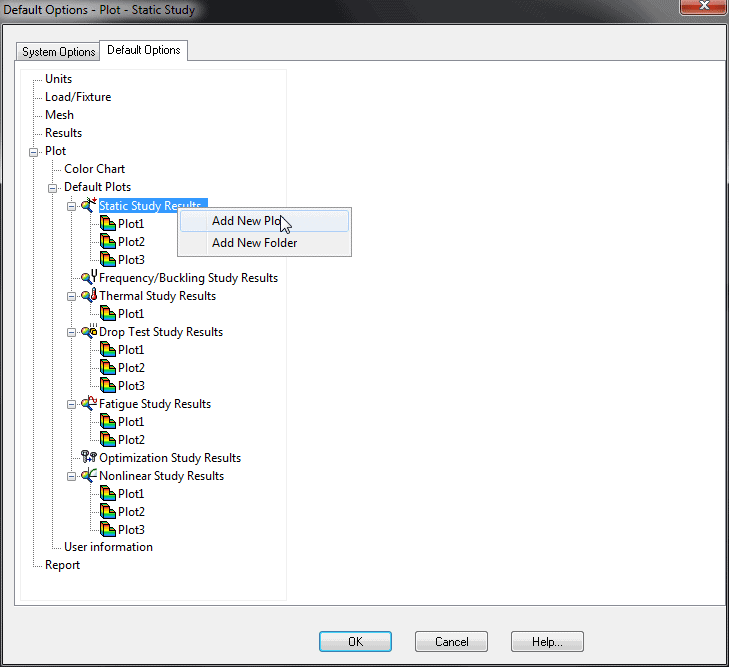
The last set of options govern the Default plots; this is where the user decides what result plots Simulation display. If you find yourself continually adding a Factor of Safety plot, for example, you’ll want to become familiar with the changes you can make.
By right clicking on the Study you can add additional plot and plot folders for further organization.
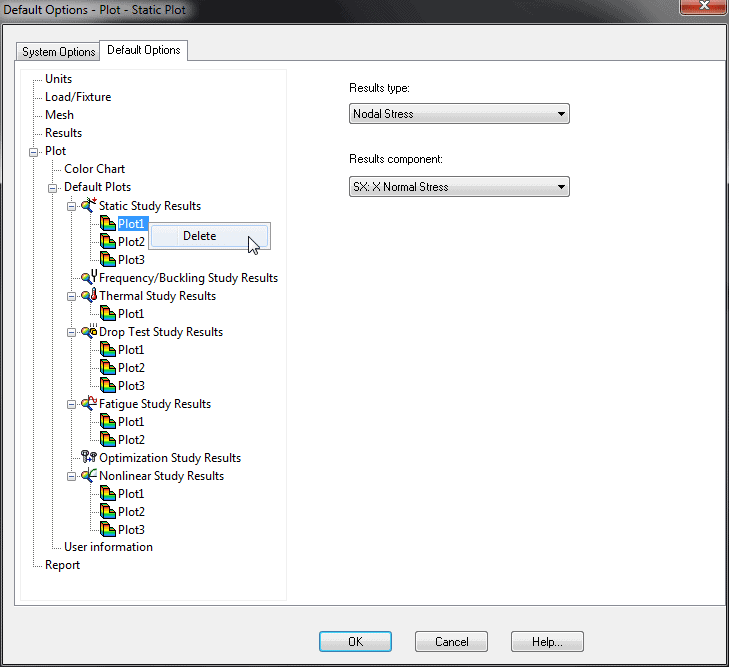
Existing plots can be changed by clicking on them and two drop down lists become available; Results type and Results component. If there is a plot you no longer need, it can be removed with a right click.
As you can see, there are many options in Simulation. This article doesn’t show every Options screen or available setting. I recommend you take a look at the options and familiarize yourself with them. If you have any questions on a setting, click the Help button to see what the documentation has to say and if you need additional information, please give us a call.
Read more SOLIDWORKS Simulation articles.
Author: Kris Dubuque