SOLIDWORKS 2018 What’s New – Flow Simulation Plot Callouts – #SW2018
SOLIDWORKS 2018 What’s New – Flow Simulation Plot Callouts – #SW2018
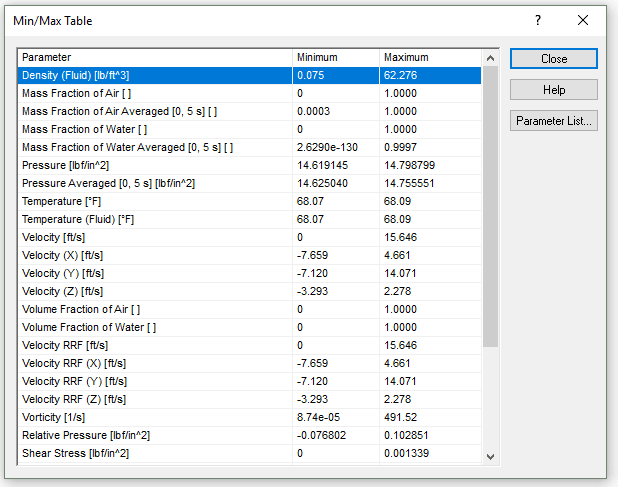
SOLIDWORKS users have long been able to add callouts for maximum and minimum stress in SOLIDWORKS Simulation (FEA). Callouts point the user to the area with the max/min plot values without having to search for these extremes. In the past users lacked min/max callouts in SOLIDWORKS Flow simulation (CFD). Users had to resort to probing the plot in various locations and viewing a min/max table. The table shows the min/max values for the entire volume in the study.
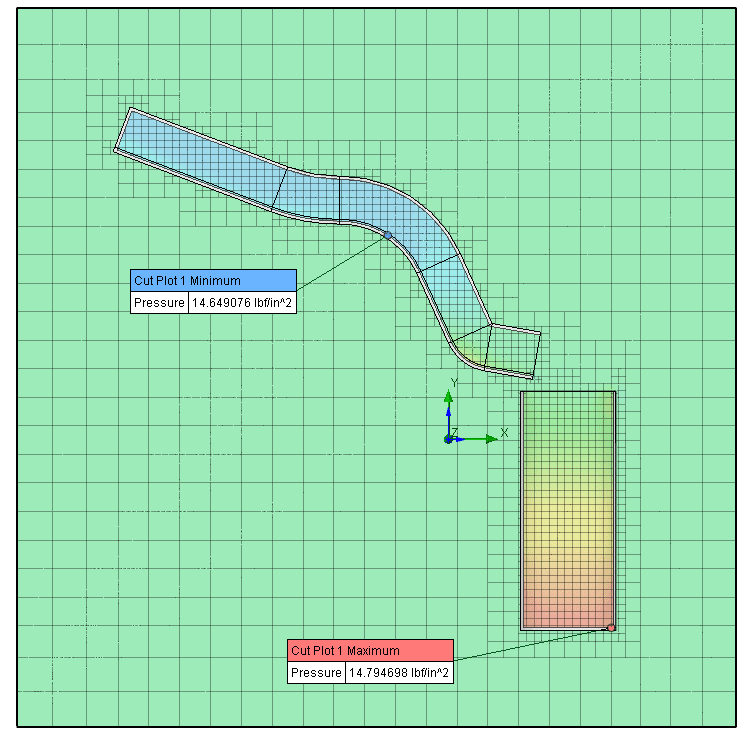
Now in 2018 SOLIDWORKS Flow users have access to the min/max callouts in their plots (see image below). These min/max values display based on the parameters of the current plot. Min/max callouts supported for cut and surface plots only.
I hope this part of the What’s New series gives you a better understanding of the new features and functions of SOLIDWORKS 2018. Please check back to the CATI Blog as the CATI Application Engineers will continue to break down many of the new items in SOLIDWORKS 2018. These articles will be stored in the category of “SOLIDWORKS What’s New.” You can also learn more about SOLIDWORKS 2018 by clicking on the image below to register for one of CATI’s Design Innovation Summits.
Matthew Fetke
Application Engineer