SOLIDWORKS Simulation: Result Plot Tips – Part 2
In a previous CATI blog accessible here, several tips were presented related to post-processing SOLIDWORKS Simulation results. It featured stress plots on mixed mesh models, showed how to present results on selected entities, and highlighted the Stress Hot Spot Diagnostics tool to locate stress singularities. Here I will mention others that I use nearly every time I conduct an analysis.
Controlling plot display via the color bar
The image below shows the items that are available via right mouse button (RMB), click on either the plot icon or the color bar. The “Quick Controls” label on the image shows items that were previously only available in the plot edit tabs, like changing the component displayed in the plot or how the fringe is represented and toggling the mesh overlay.
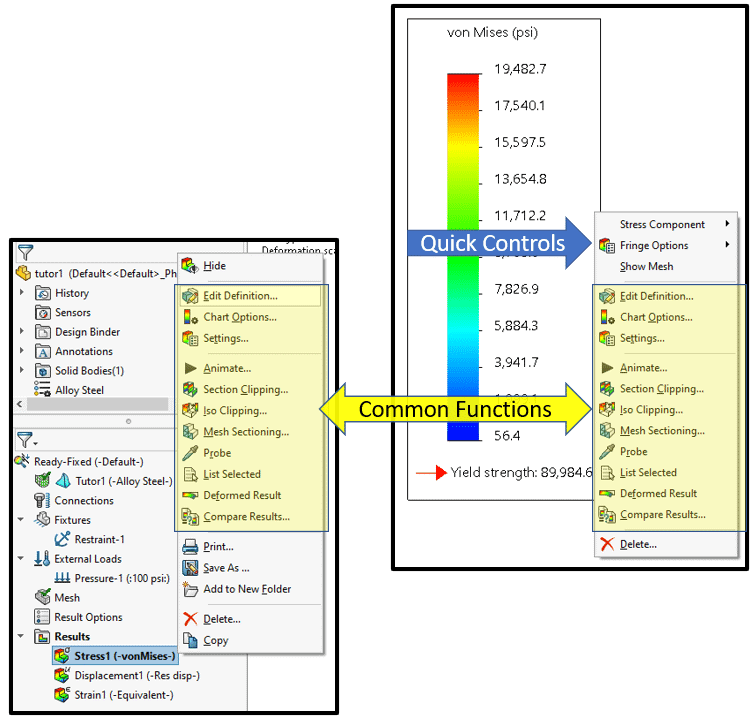
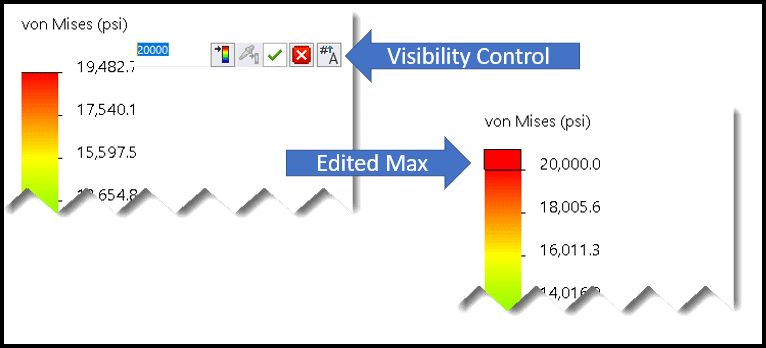
The color bar max/min values can be manually changed and their markers on the plot can be hidden or shown directly from the bar. These tools added to the color bar RMB click definitely speed up the workflow for me!
Color bar appearance
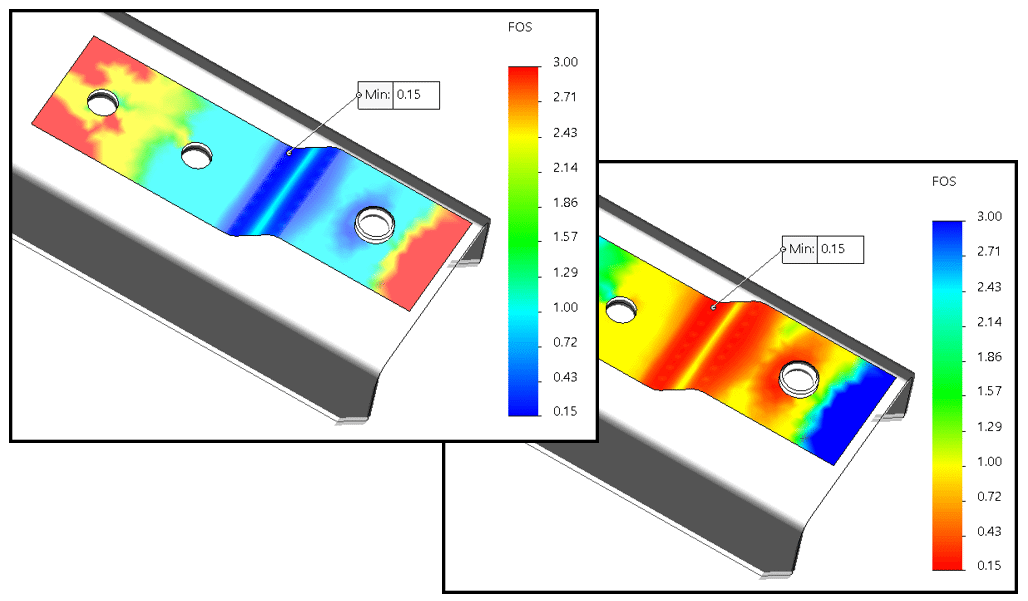
Most plots will accurately convey results using the default settings for the color bar, e.g., think about high stress and displacement, indicated by the red color at the top of the bar. For some plots, like factor of safety (FOS) it is helpful to see the red color at the bottom of the bar, where the FOS is lowest. Here are two versions of the same FOS plot. If we look for the red color, the first one shows high FOS (good) in red (not good). The second shows clearly that the lowest FOS is at the red end of the bar. Fortunately, if you are using the latest version of SOLIDWORKS Simulation, the bar is automatically set to show low FOS in red.
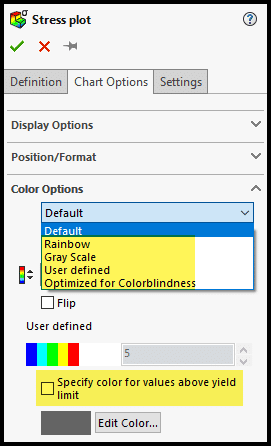
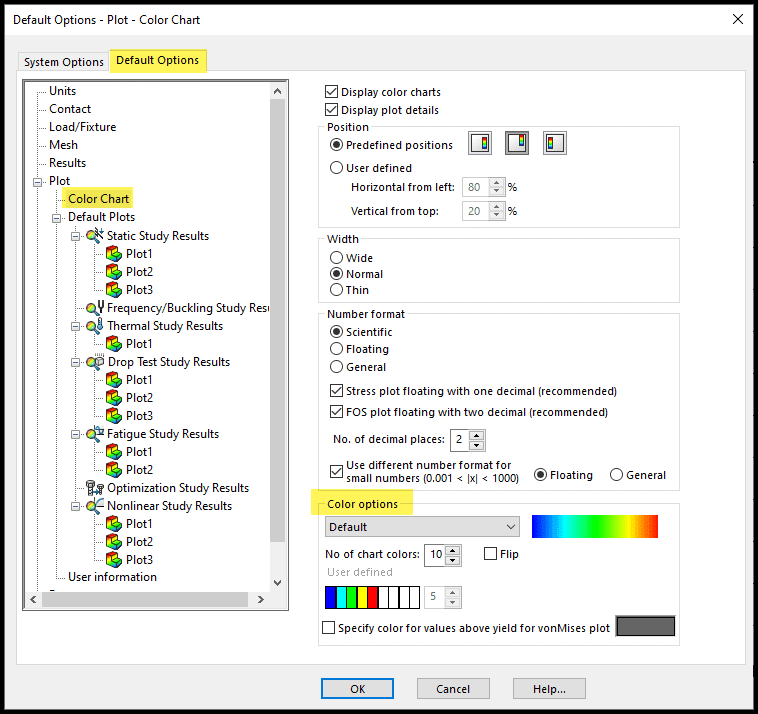
The default rainbow appearance that you see in these plots is not the only color scheme available. You can change it to gray scale, user-defined, or one that is optimized for colorblindness. Also, for stress plots you can set a unique color for contours above the yield limit. Both options are found under the “Chart Options” tab during plot generation or editing.
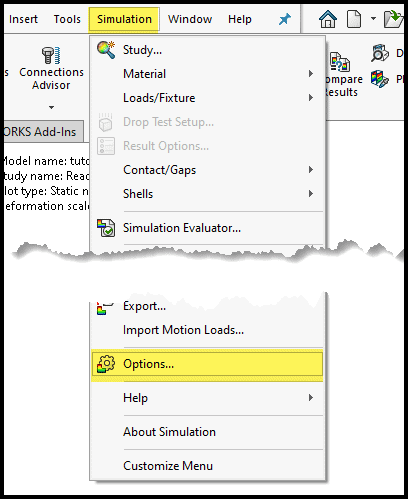
Don’t forget to set your favorite options for the color bar in the Simulation Options window. These settings become the default for subsequent plots. It’s accessed via the Simulation pull down menu and contains many more settings that will reduce the required effort to set up and post-process your studies.
Thanks for reading this blog; I hope it helps make your workflow for post-processing SOLIDWORKS Simulation analyses smooth and easy!
Kurt Kurtin
Sr. Product Manager, Simulation
Computer Aided Technology, Inc.
For Part 1 of this blog series: https://www.cati.com/blog/2018/08/solidworks-simulation-result-plot-tips/
For a static simulation highlights blog: https://www.cati.com/blog/2017/12/solidworks-static-simulation-highlights/