Beam Diagrams in SOLIDWORKS Simulation
Are you aware that you can produce beam shear and bending moment diagrams in SOLIDWORKS Simulation? This useful plot type allows for quick visualization of these results along the entire length of a beam. I’ll show you the functionality using a classic example from any Civil Engineering text on strength of materials, the case of a simply supported beam of length “L” with a centered load “P” applied at the center of the span.
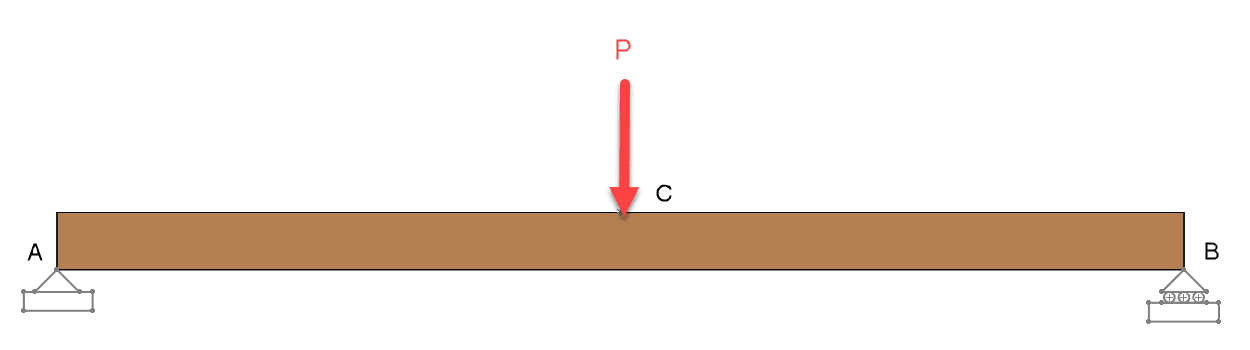
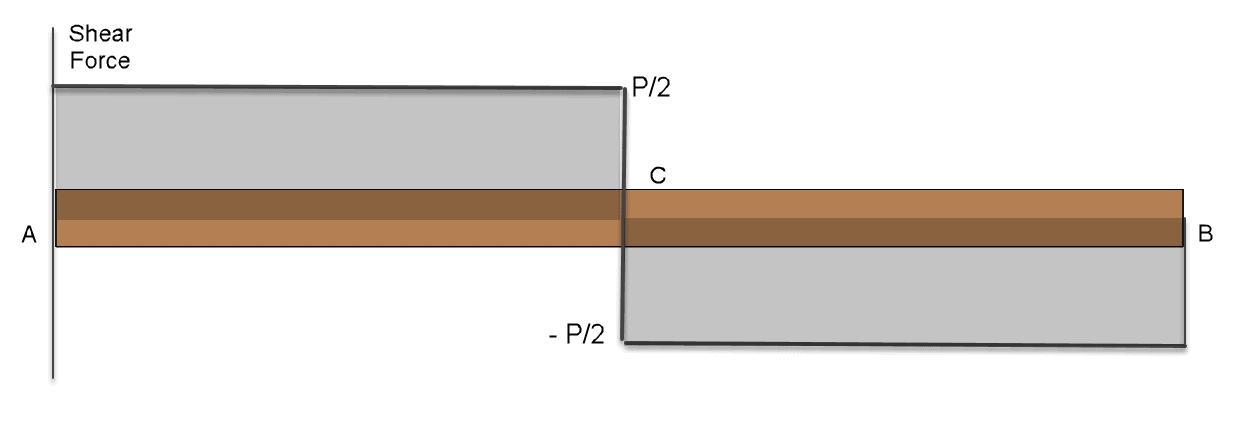
In the analytical solution for shear and bending along the length of the beam the shear force at each end is equal to one half of the applied load and it reverses at the mid-span location.
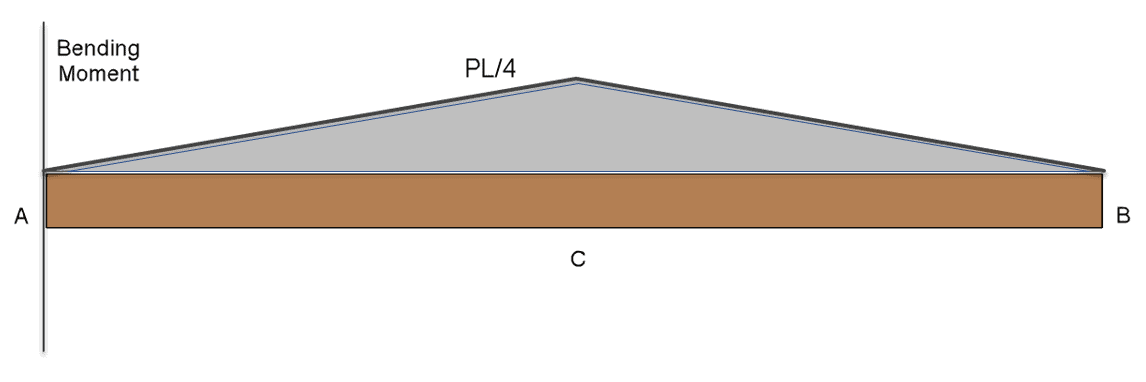
The bending moment is zero at each end and at mid-span, it reaches a peak value of one-fourth of the product of applied load times beam length.
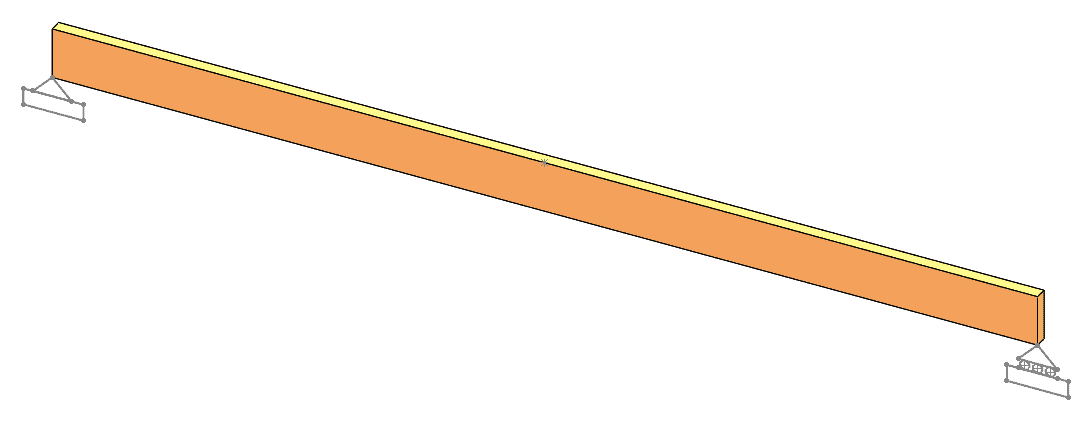
A 3D model of the beam is shown in SOLIDWORKS with a sketch representing the supports at each end. In our case, the beam “L” is 6 meters and the applied load “P” is 20,000 Newtons, so we are expecting maximum shear and bending moment values of 10 kN and 30 kN-m, respectively.
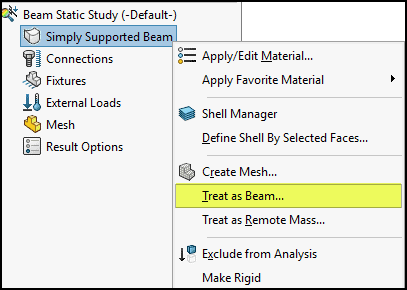
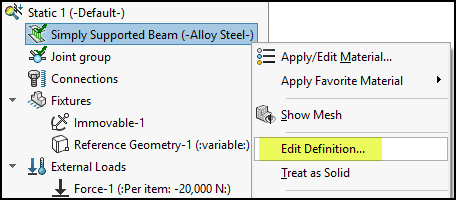
After creating a Simulation static study based on this geometry, you’ll find that the part is set to be meshed using solid elements, by default. To get the desired beam diagram output, we direct the program to treat the solid as a beam instead via a right click on the part in the Simulation tree.
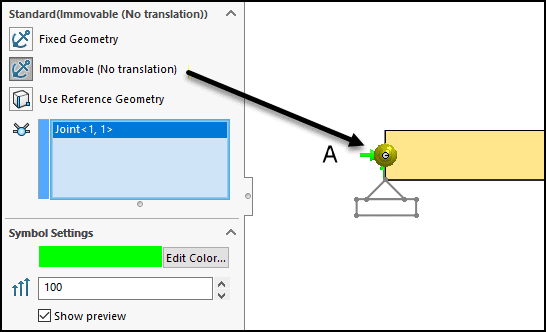
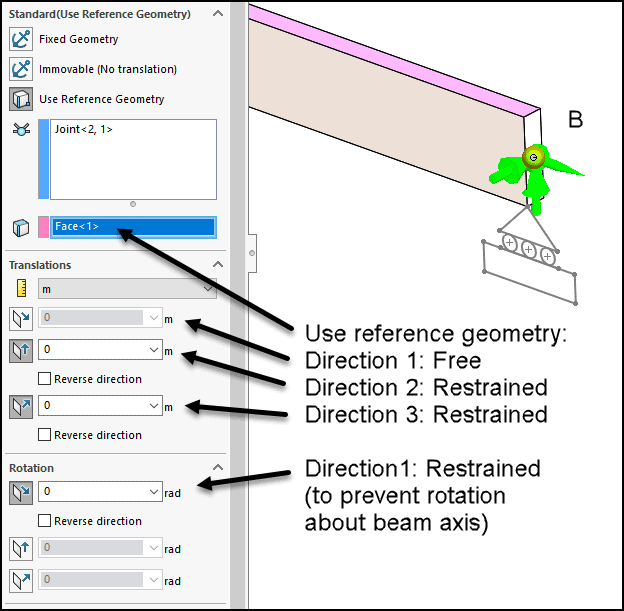
For beam elements, nodes are automatically created at each end and we can apply fixtures to them to designate the appropriate support conditions.
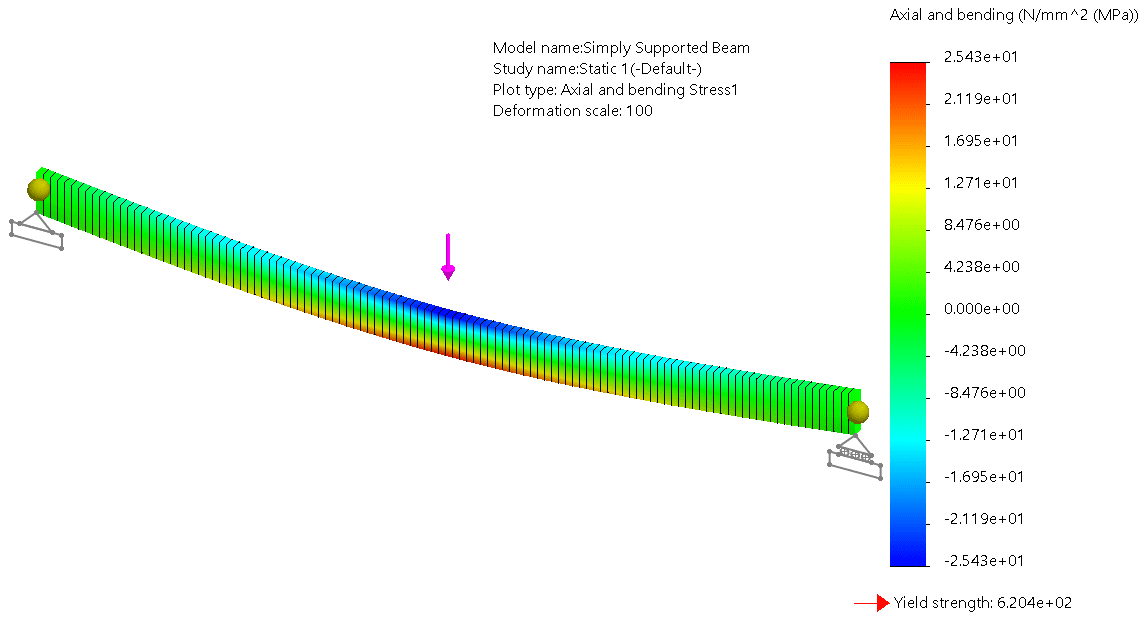
After meshing and solution, the familiar stress and deflection plots are available. Axial and bending combined stress is shown below.
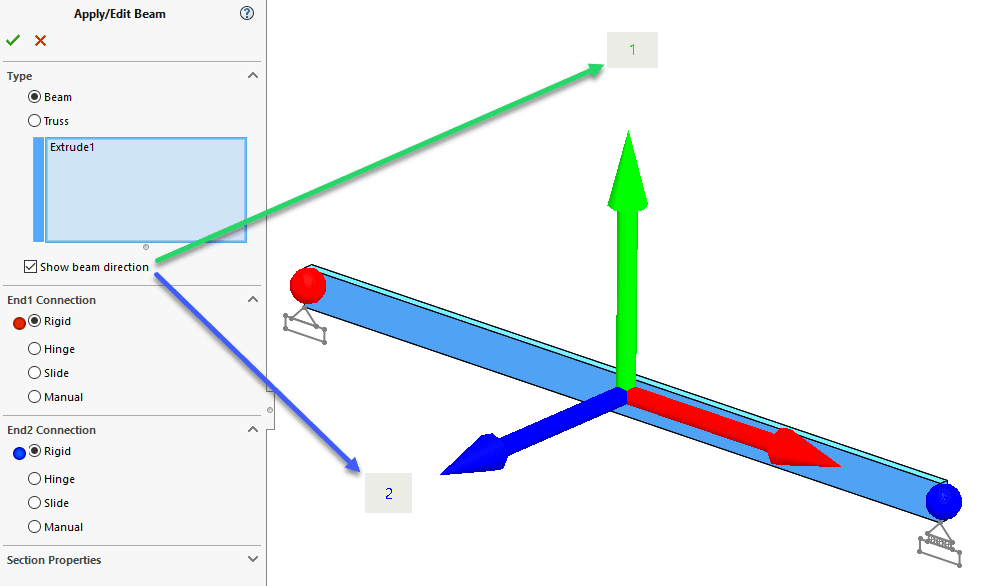
Before generating beam diagrams, we need to know about the beam orientation to decide which direction to choose when setting up the plots. The longest dimension of the beam’s cross-sectional profile is Direction 1 and Direction 2 is perpendicular to it. To get visual confirmation of this information, you can right-click on a beam part in the Simulation tree, select “Edit Definition” and check the box to show beam direction.
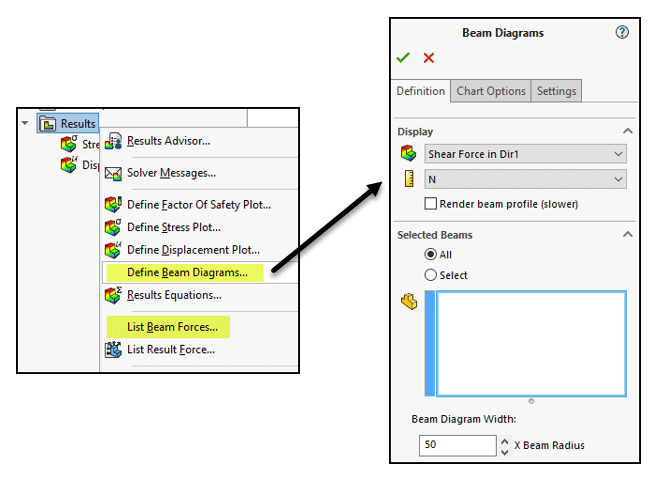
Now we are ready for the diagrams! A right-click on the Results folder gives us the plot option “Define Beam Diagrams”. You may already be familiar with the second item highlighted below for listing beam forces, another handy post-processing feature unique to beam-meshed parts and assemblies.
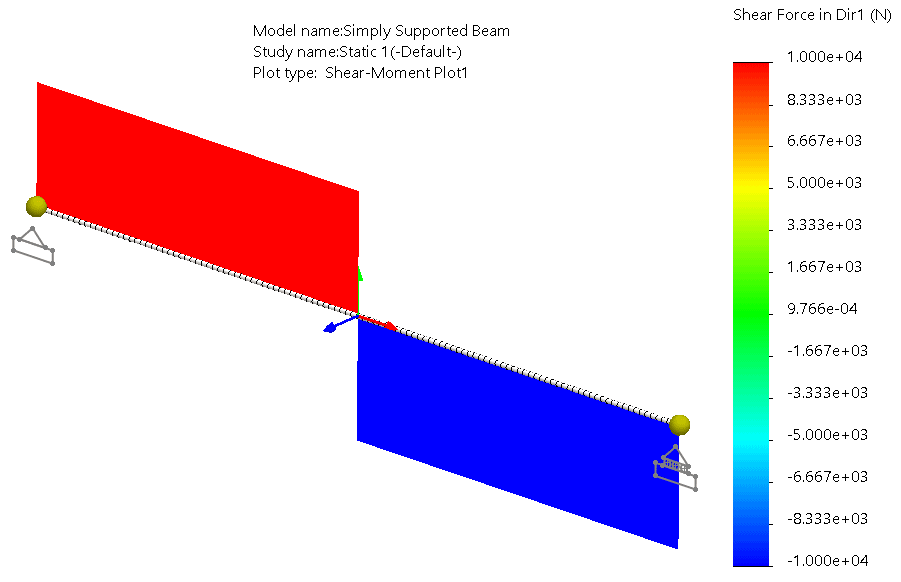
The resulting plot of shear force in Direction 1 is produced and shows the expected value of 10 kN with the reversal at the mid-span.
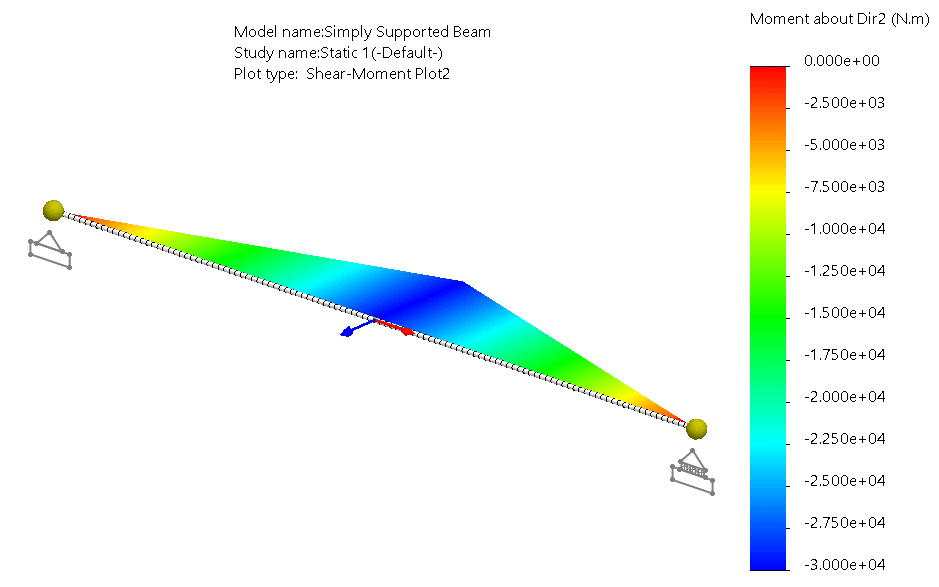
Taking similar steps, we produce the expected bending moment diagram with a peak value of 30 kN-m at the mid-span. (One minor thing you may notice about this plot is that the diagram is oriented in the direction of the quantity selected, in this case, Direction 2. Intuitively, it might be better to show the plot rotated 90 degrees from this orientation to line up with the actual plane of bending. This is the subject of a current inquiry into the SOLIDWORKS technical support team as a possible enhancement request – we’ll see what they say!)
Try this great post-processing feature in a future analysis of yours that incorporates a beam mesh. Hopefully, it will help you continue to get useful output to support your engineering analysis efforts.
Kurt Kurtin
Technical Manager, Simulation Products
Computer Aided Technology, LLC