How Do I Complete a Simulation Fatigue Analysis in SOLIDWORKS?
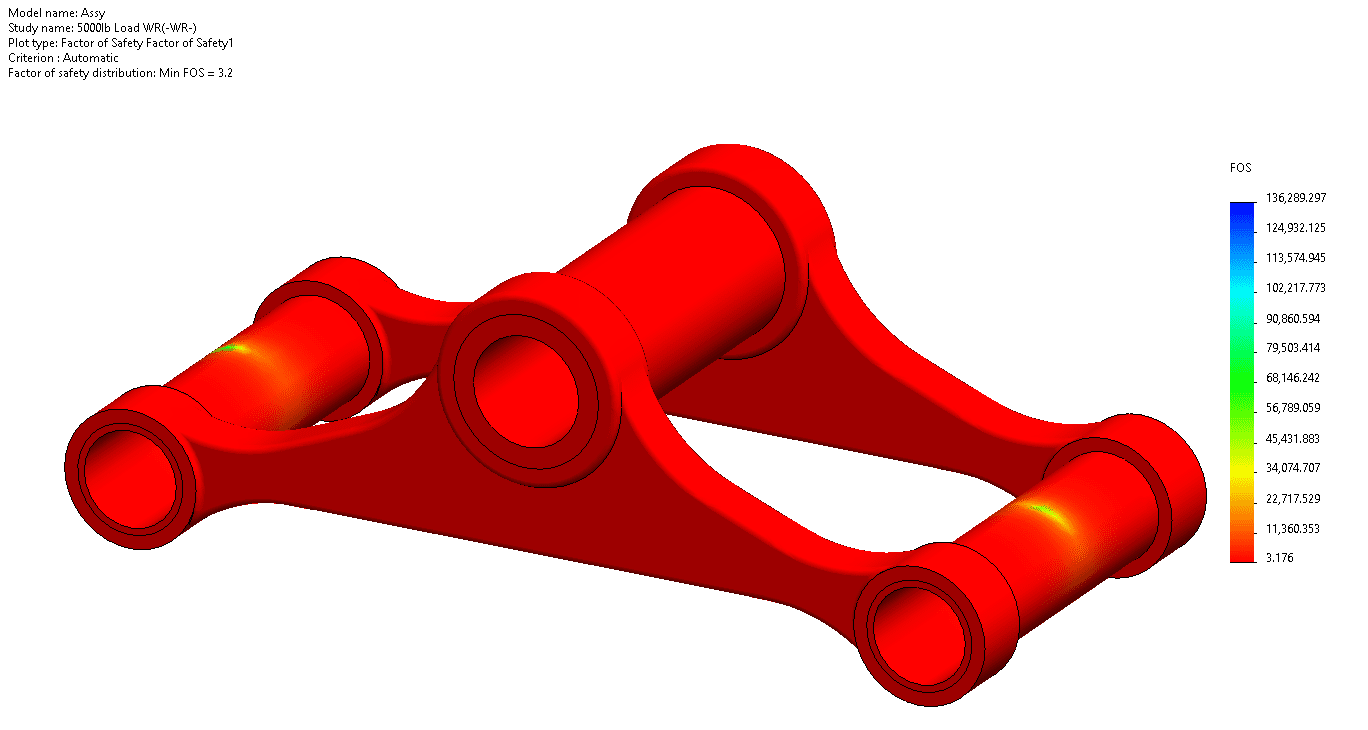
How do I complete a Simulation Fatigue Analysis in SOLIDWORKS Simulation Professional? A Fatigue study leverages existing analyses as Load Events. To start a Fatigue analysis typically a linear static analysis, or multiple linear static analyses are utilized as base studies. Verify that the base study, or studies, have a factor of safety greater than 1, usually 1.5 and up is a good rule of thumb for high cycle fatigue.

Once the base study or studies are complete the next step is to start the Fatigue analysis.
Start by selecting Fatigue for the study type. Select the type of Fatigue analysis you wish to complete. The choices are Constant Amplitude, Variable Amplitude, Harmonic, or Random Vibration. Note that Simulation Premium is required for Harmonic and the Random Vibration Fatigue types.
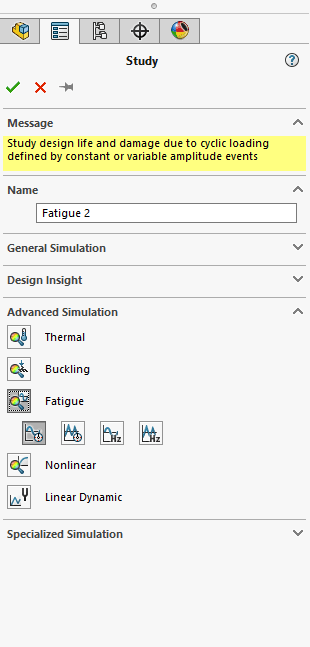
A Constant Amplitude study type was chosen for this blog.
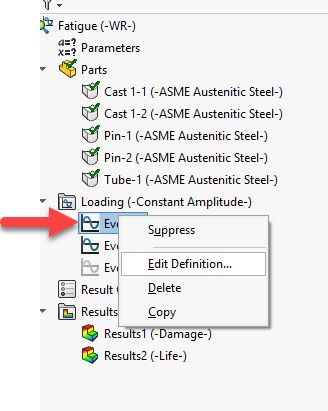
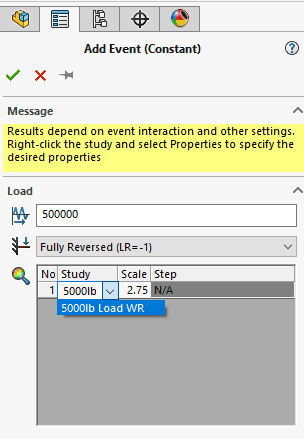
The Fatigue study opens and the first thing to apply is the Event, or Events. The Event is how the Fatigue Study links to the base study. Multiple Events can be combined to understand cumulative damage.
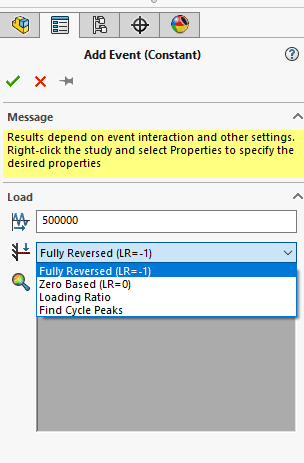
Specify the number of cycles for the event. Choose if you want to apply the Event as Fully Reversible, Zero Based, Load Ratio, or Find Cycle Peaks.
Choose the study you wish to link to.
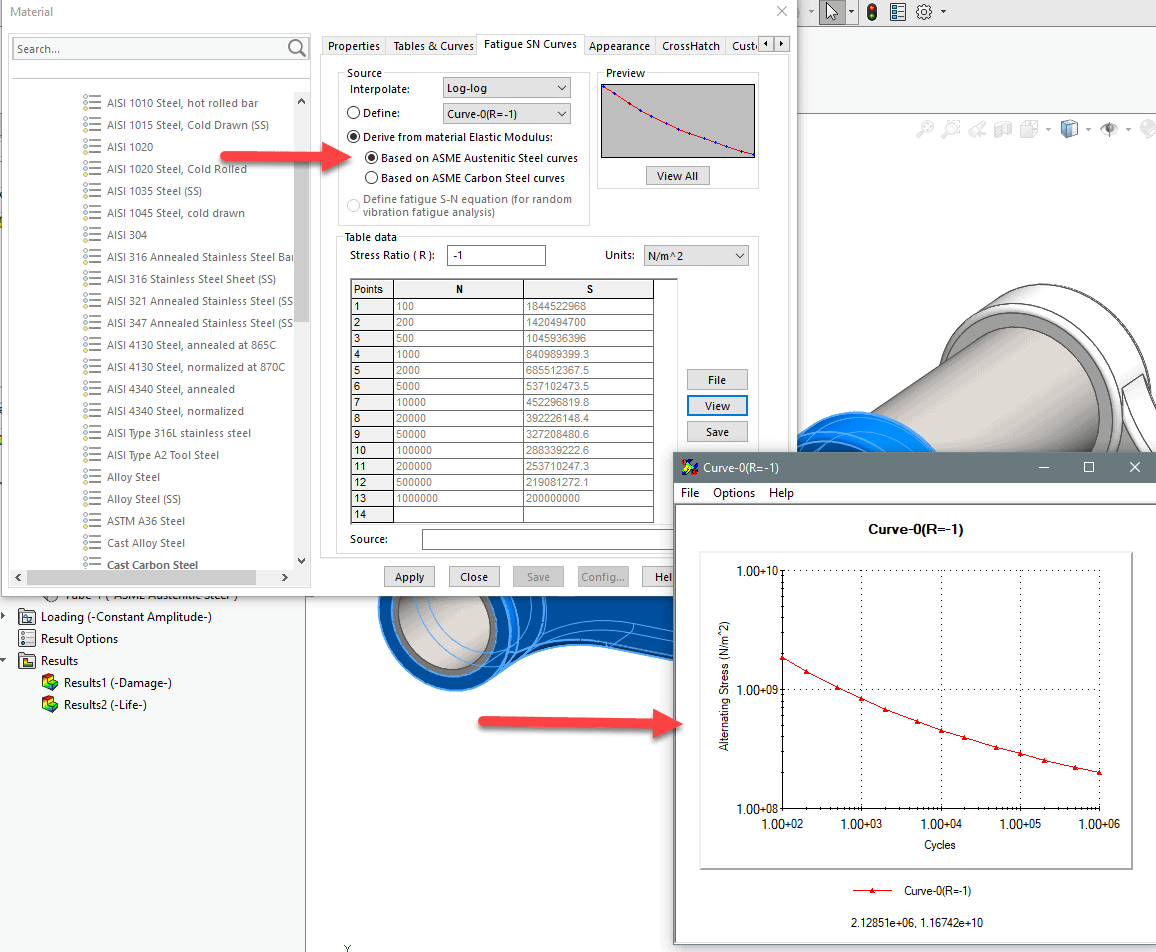
Assign the material’s Stress to Number of Cycles (SN) curve. Typically, this is empirical data that needs to be tested. “Atlas of Fatigue Curves” and other references exist that provide SN curves for common materials.
Run the study and review the results. For Single event Fatigue studies, a Life Expectancy plot is available. This predicts the life above or below the specified number of cycles. The plot below shows the life expectancy is roughly 600K cycles.
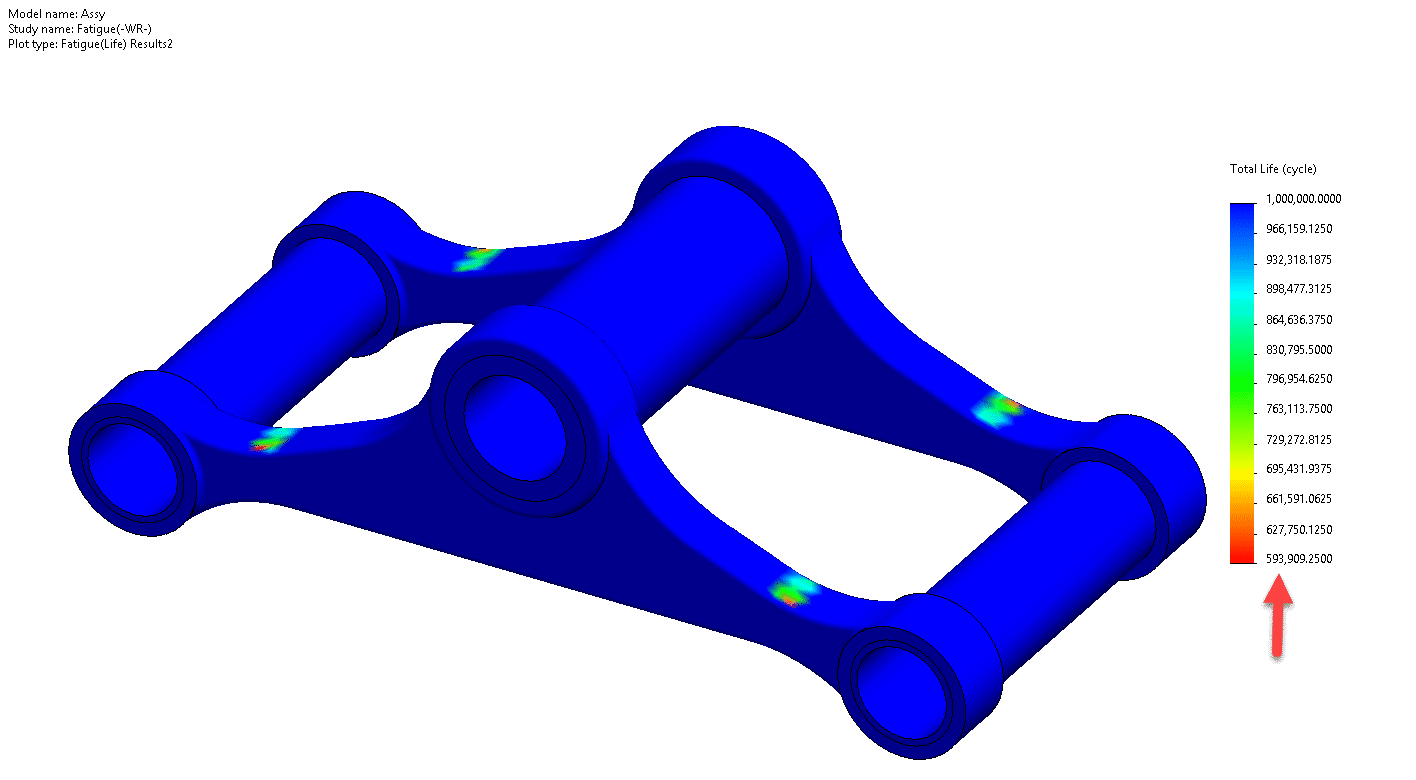
Single and multiple event Fatigue studies provide a Damage Percent plot as well. Damage below 100% shows the design will last more than the number of cycles specified in the setup. A damage percentage above 100% indicates the design will last less than the number of cycles specified in the setup. Note that if you receive a warning indicating the alternating stresses are too low, or the damage plot is only 50%, and the life expectancy is 1 million the design has a high factor of safety and the design has met its endurance limit and will not fail.
That’s all. The setup is that easy. Let SOLIDWORKS Simulation do the heavy lifting and predict life expectancy and the percent damage of your design. Don’t let your design grow tired and weary before you want it to. It is important to know how your design performs once as well as multiple times. Fatigue analysis gives the engineer just that.
This blog has an accompanying video under the same title. Check out the Computer Aided Technology video page for more information and subscribe.
Robert Warren
Simulation Specialist, Elite Application Engineer
Computer Aided Technology, Inc.