Learning SOLIDWORKS Motion: Shortest Distance Between Two Points is a Straight Line?
You have to make learning fun, right? So, while anyone can go take a course about SOLIDWORKS Motion and understand how to use the tool, it’s way more interesting when we can prove something that was first thought about by Galileo almost 400 years ago! That’s what we’re going to do today, make learning SOLIDWORKS Motion fun by taking a look at the Brachistochrone Curve.
Background
Everyone always says the shortest distance between two points is a straight line. But, is it really a straight line and is that the shortest amount of time? Have you ever heard of something called the Brachistochrone Curve? The word “Brachistochrone” /brekistekron/ is actually two words in Greek for “shortest time”. This was first pondered by Galileo Galilei in 1638, who thought that an arc of a circle would be the best option for a particle of light going from point A to point B in the shortest period of time. The arc is a good option, but there are better solutions.
Let’s fast-forward to 1696, Johann Bernoulli posed the shortest path thought as a challenge to all the mathematicians, specifically Isaac Newton. At that time, Sir Isaac was a lot older than Johann. Oddly, Isaac Newton didn’t like to be challenged by someone he felt was beneath him academically. So, he decided to take on the challenge and found a solution within a single night while it took Johann two weeks to solve. Isaac then proposed his answer anonymously in a journal called “Philosophical Transactions”. Apparently, after Johann read it, he responded with “I recognize the lion by his claw”.
So, what Johann concluded was that as the particle moves down a curved path, because of conservation of energy, the velocity (v) of the particle is proportional to the square root of the distance from the top of where the particle started. See Figure 1 below. Therefore, the loss in potential energy can then be set equal to the kinetic energy. If we take those equations and solve for the velocity, we see that the velocity becomes proportional to the square root of the distance “y” from the top of where the particle started. See Figure 2 below. Now, since v is proportional to y it follows that as the particle moves down the curve it is also following what is called Snell’s law everywhere on the curve. See Figure 3 below.
So, if we look at whatever the time minimizing curve is, and take any point on a curve, the sine of the angle between the tangent line at that point and the vertical divided by the square root of the vertical distance between that point and the start of the curve will become some constant independent of the point chosen. After seeing this Johann recognized it as the differential equation for a cycloid. Cycloid being the shape traced by a point on a rim of a rolling wheel. See Figure 4 below.
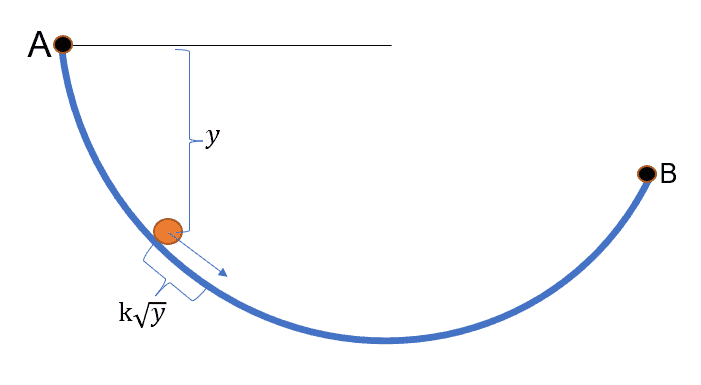
Fig. 1 Particle on curve path
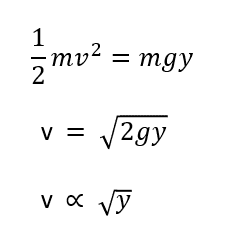
Fig. 2 Velocity proportional to square root of y

Fig. 3 Snell’s Law correlation
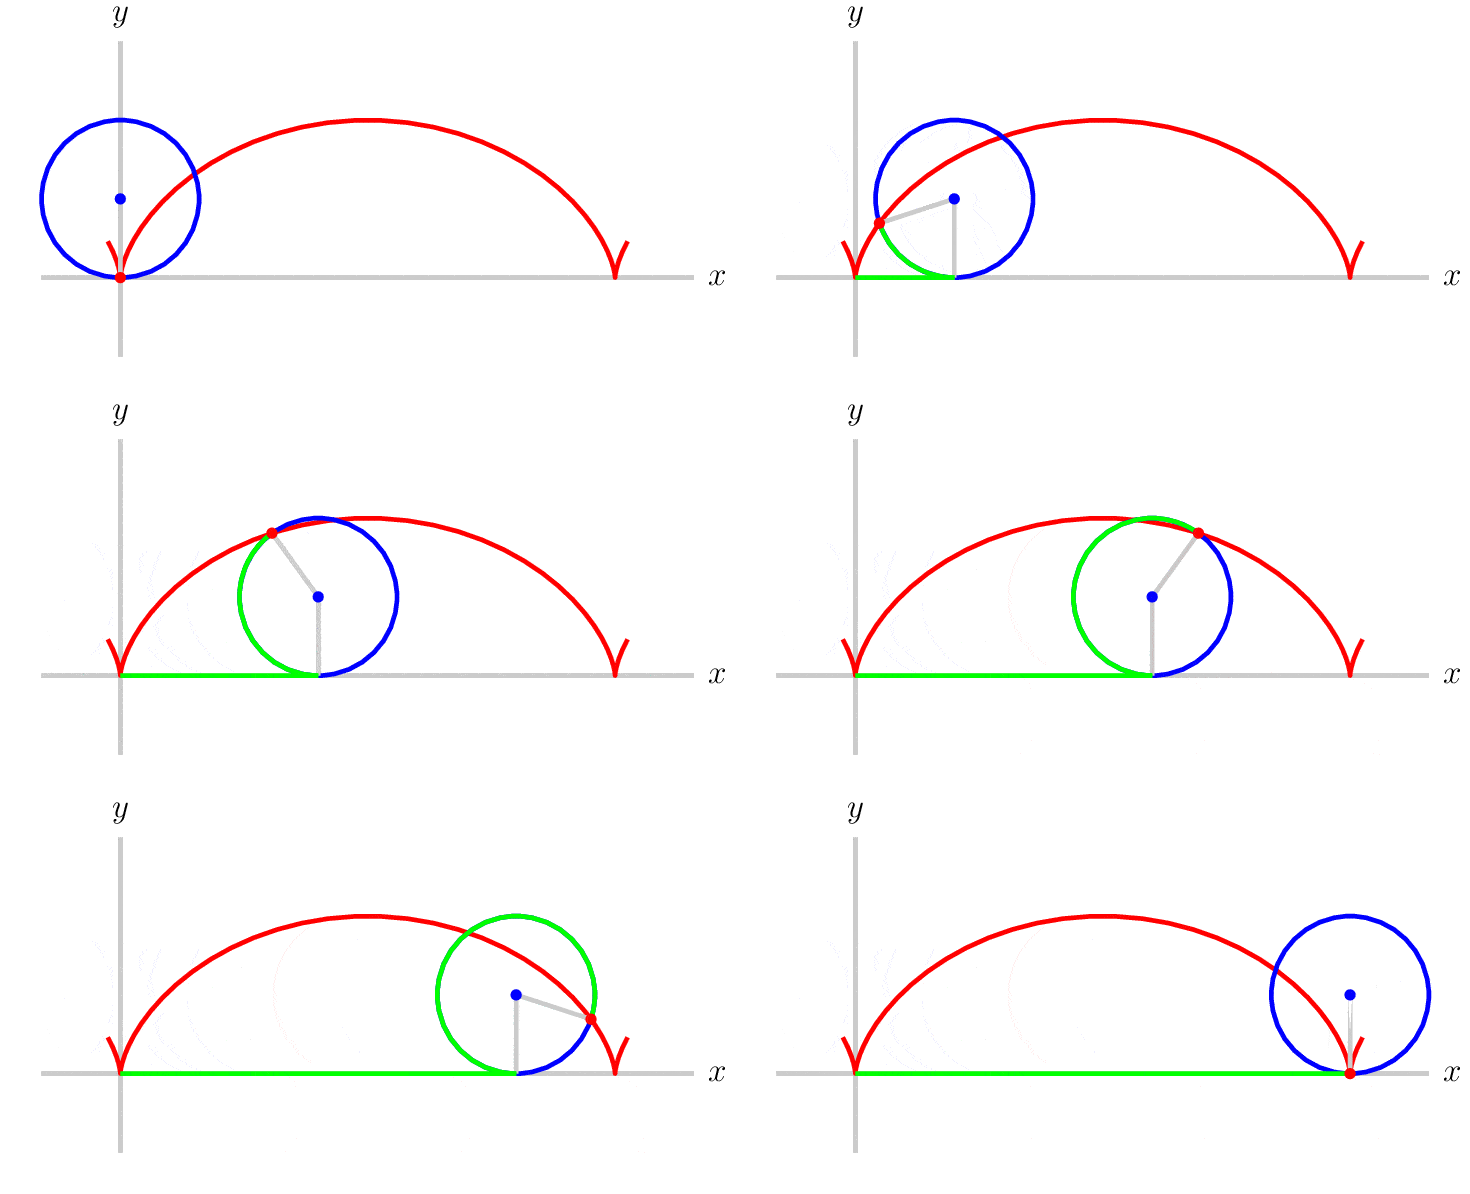
Fig. 4 Cycloid traced path
Now, you may be asking what does sine of theta divided by the square root of y have to do with a cycloid. Well, in 2015 a professor and mathematician at Penn State named Mark Levi published a note showing that if you look at the geometry of a cycloid, and through a few modifications at the right places, the principle of velocity over the sine of theta becomes constant. From there we find Snell’ law is embedded into the motion of the cycloid itself. This was a great discovery in proving why the cycloid path would be the shortest time a particle would have to take to get from point A to point B.
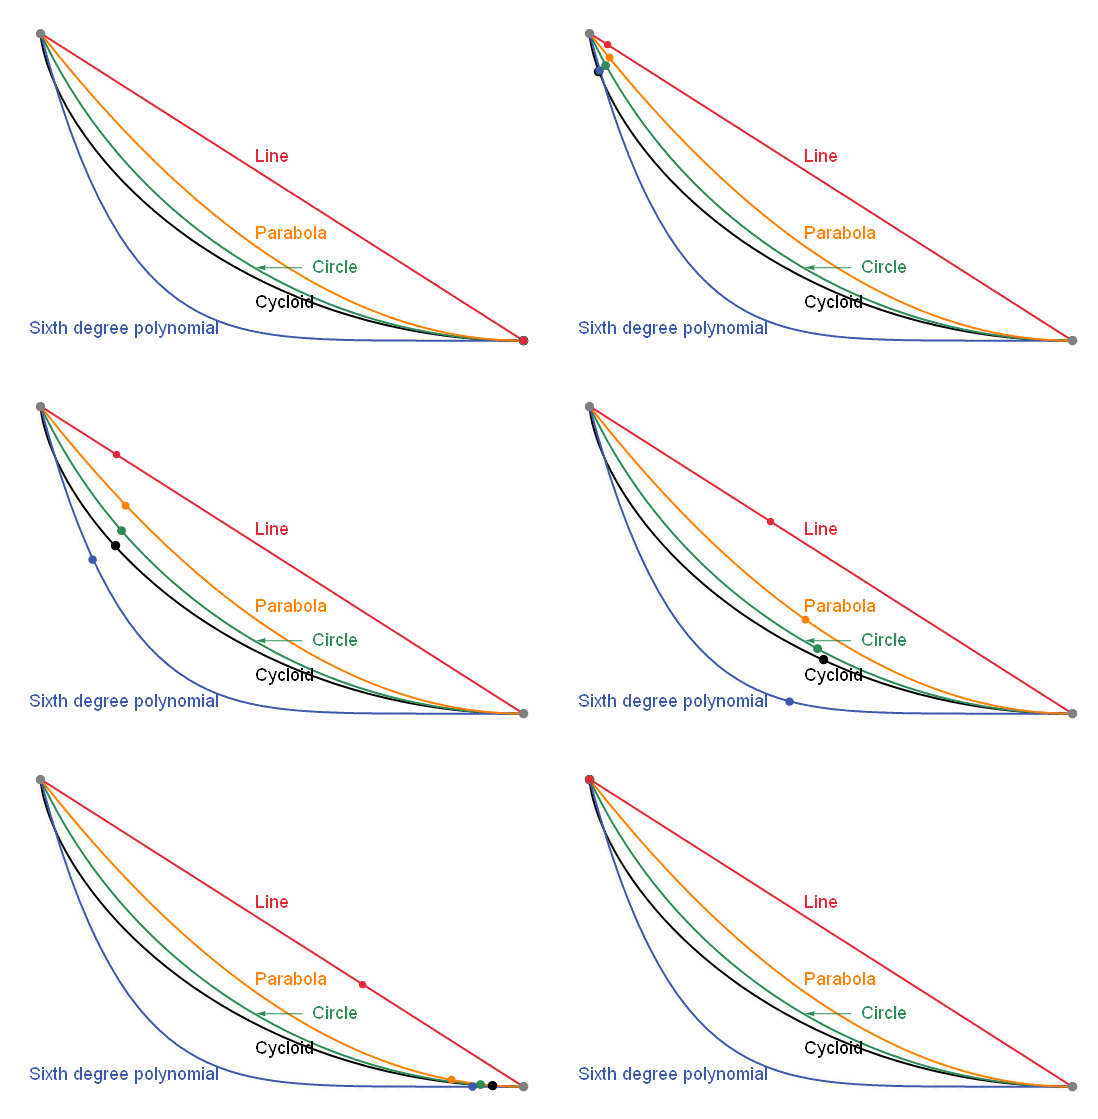
Fig. 5 Cycloid path versus other paths
Testing and Learning with SOLIDWORKS Motion
Now, enough with the theory and math, let’s have some fun. Is there a way to show this phenomenon in SOLIDWORKS? The answer is yes using SOLIDWORKS Motion analysis which is available in SOLIDWORKS Premium and in all SOLIDWORKS Simulation packages. A problem like this is exactly the thing to start learning SOLIDWORKS Motion and getting our feet wet. To do we want to design something similar to Figure 6 below. The key thing is to make sure of is that one ramp is a straight path (orange ramp), the other is a cycloid path (middle blue ramp), and the third ramp is shaped more like a parabola. See Figures 7 to 9 below for the dimensions I used.
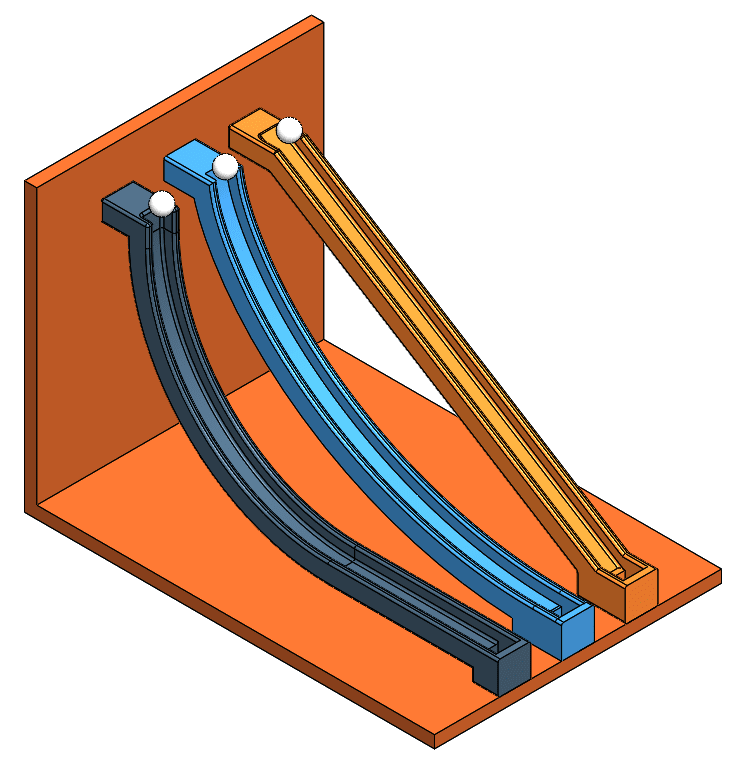
Fig. 6 Finished model views
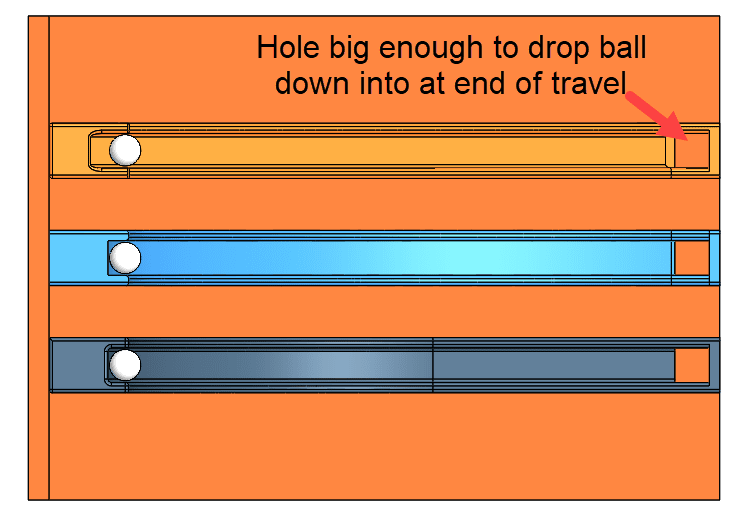
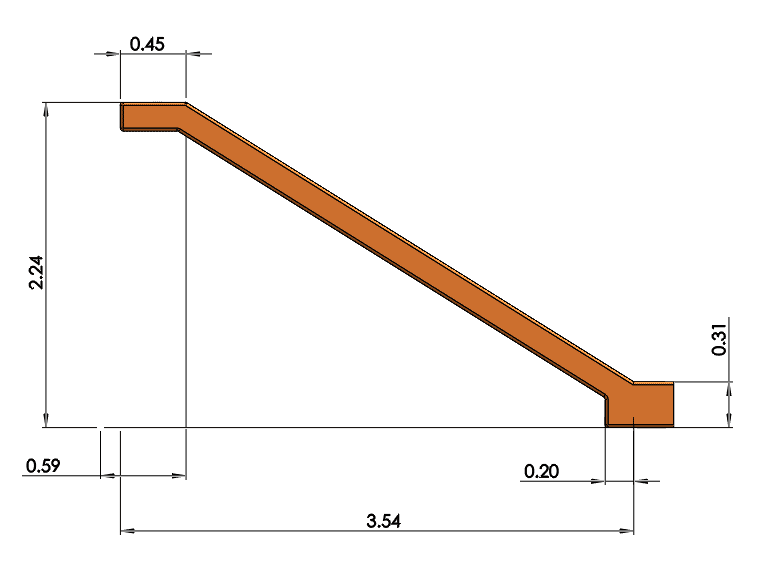
Fig. 7 Straight shaped ramp dimensions (in)
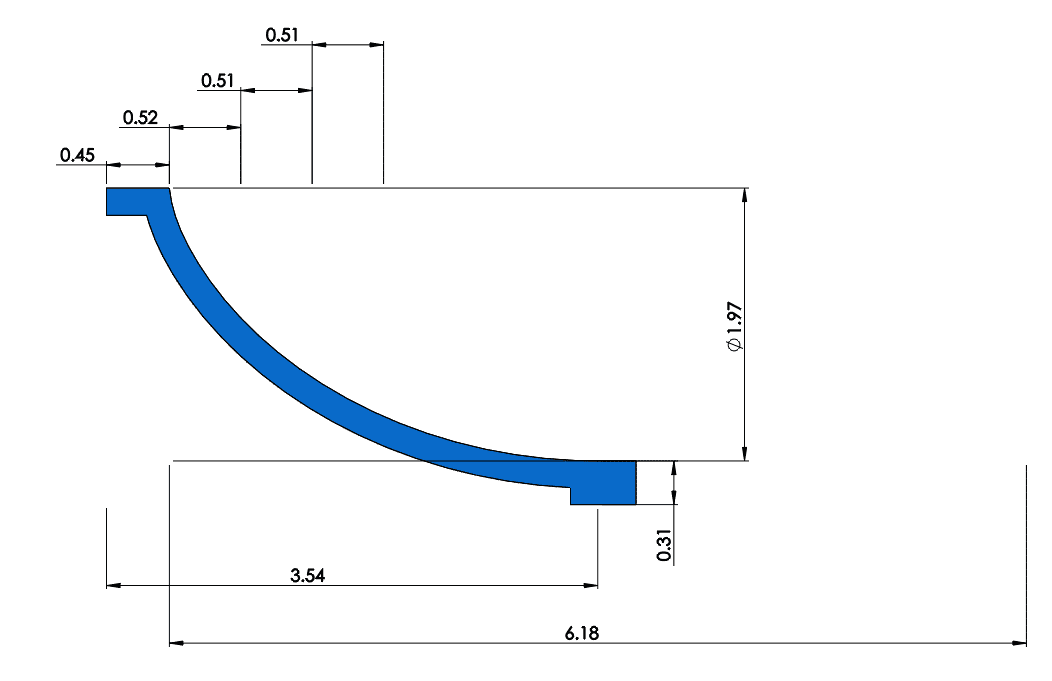
Fig. 8 Cycloid shaped ramp dimensions (in)
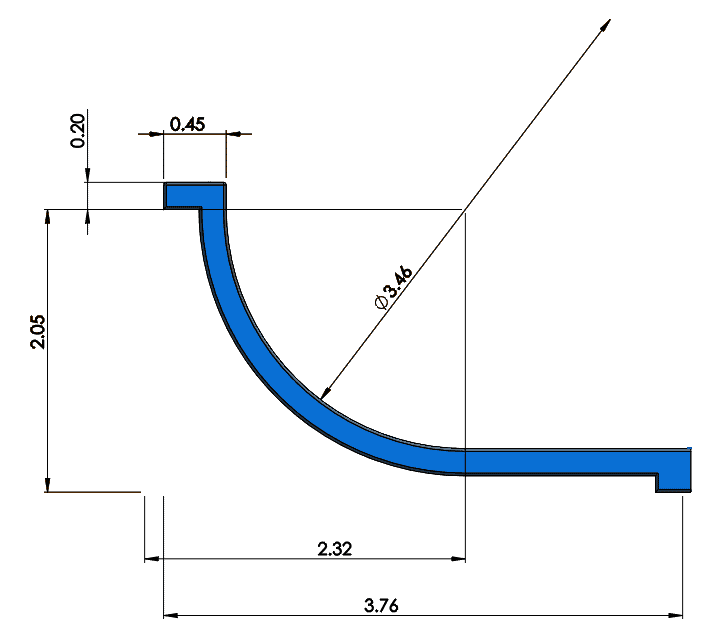
Fig. 9 Parabola shaped ramp dimensions (in)
Activate SOLIDWORKS Motion and Setup Basic Constraints
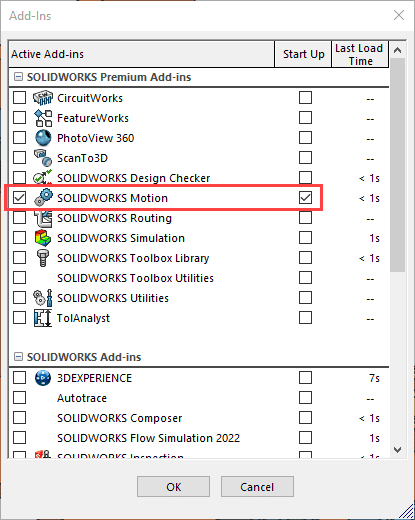
After creating your own Brachistochrone Curve assembly you will want to turn on your SOLIDWORKS Motion add-in. From there, click on the Motion Study tab at the bottom of your screen followed by switching the motion study type to Motion Analysis. See Figure 10 below.
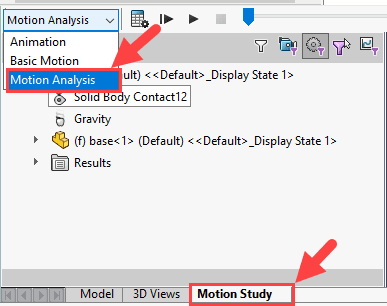
Fig. 10 Motion analysis activation
Now, we need some contacts. Let’s create a Contact for all the components of the assembly using the settings shown in Figure 11.
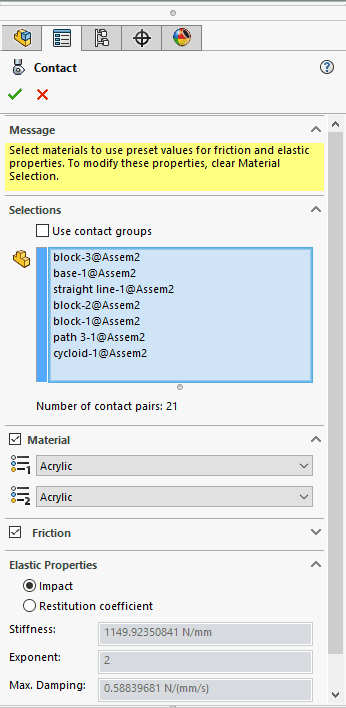
Fig. 11 Contact setup

Next, apply Gravity to the study using the setting shown in Figure 12 below. The gravity value I used is not the normal 9.8 m / sec^2. The reason why was to slow the gravitational effect down a bit in the study. This way the balls don’t bounce around a lot on the ramps during their fall. Note each ball was positioned at the same height on each ramp before being released.
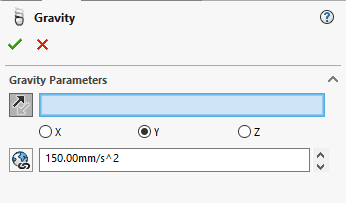
Fig. 12 Gravity setup

Next, go into the study properties and change the Frames Per Second value from 25 to 200. Doing this will result in better accuracy of how the program calculates the motion in the analysis. See Figure 13 below.
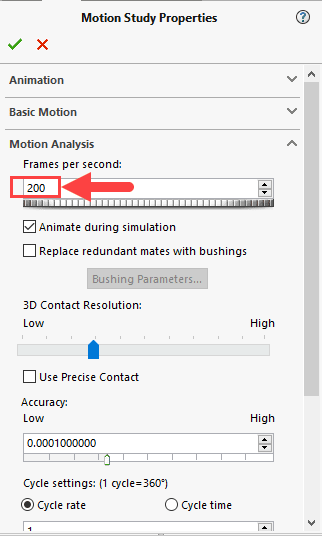
Fig. 13 Motion study properties

Next, adjust your timeline Key property to 2.5 seconds and then click the Calculate button. See Figure 14 below.

Fig. 14 Adjustment of timeline

Viewing Results of the Motion Study
Once the program calculates the analysis, the motion study animation should look something like Figure 15.
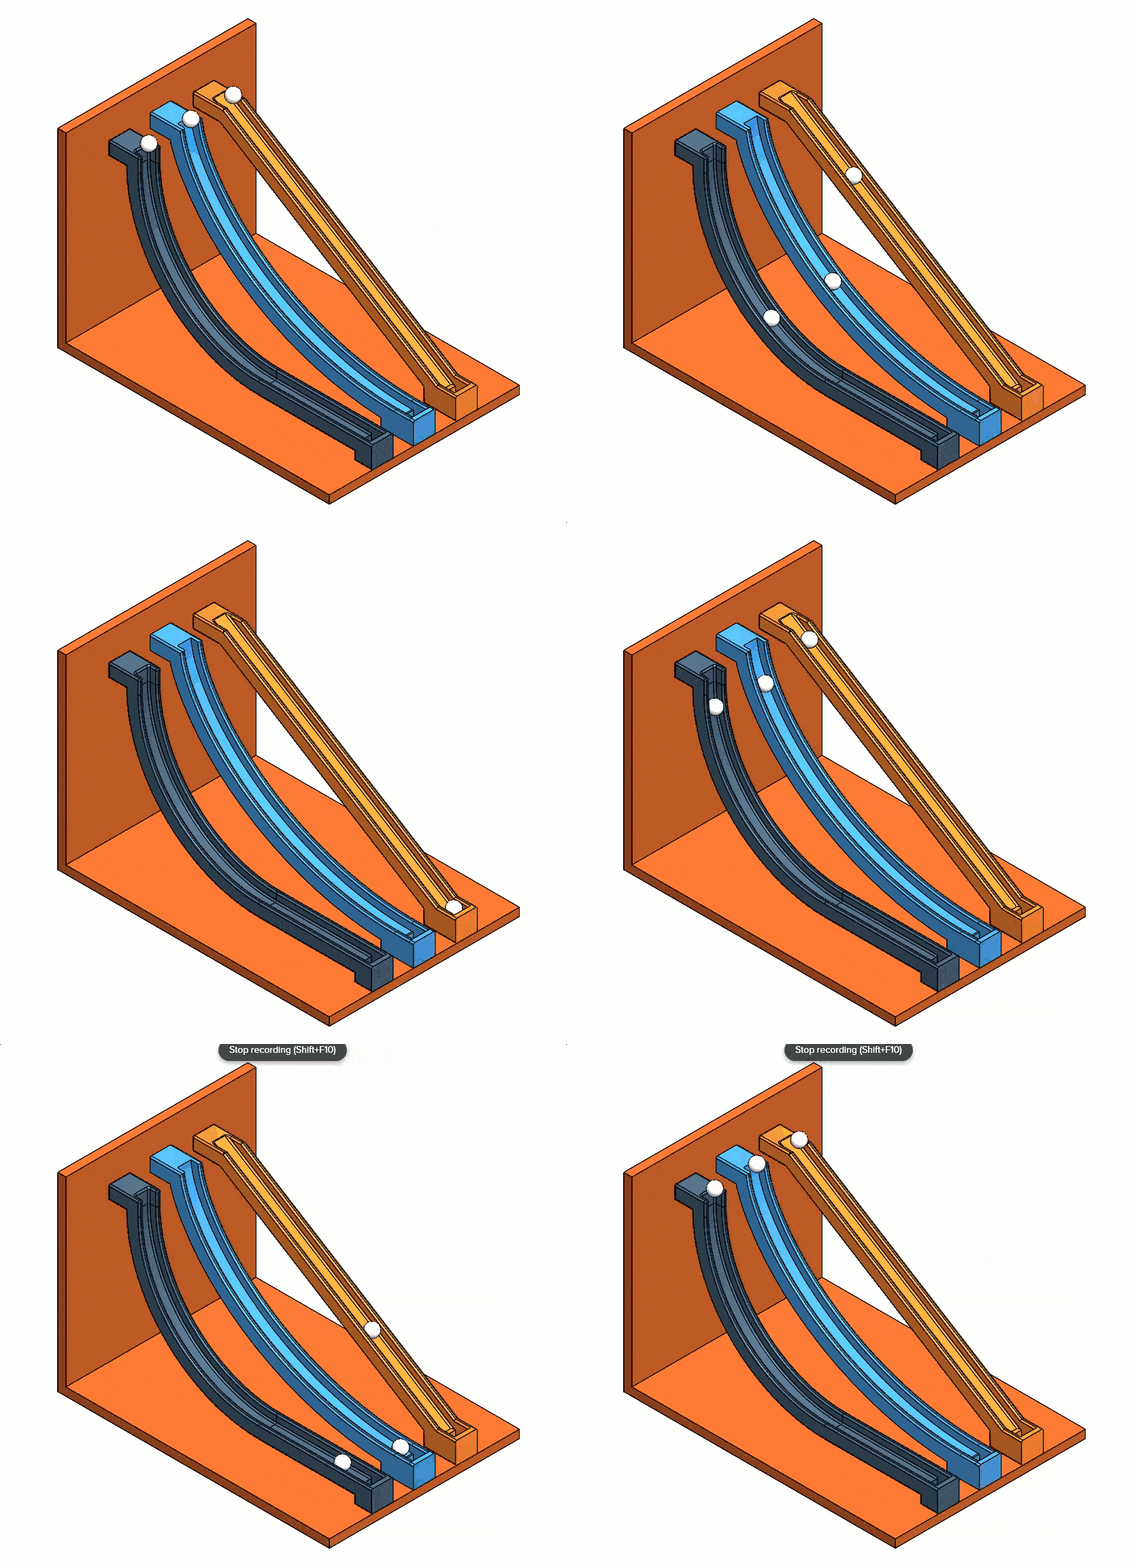
Fig. 15 Results from each study type
Now that you’ve run your Motion study animation, you can graph results like the displacement, acceleration, and/or velocity. This will give a graphical representation of each ball’s travel down the ramp. See Figure 16 below. For example, I did a linear displacement and linear velocity plot of the middle cycloid-shaped ramp’s ball. You’ll see the setup below in the figures.

Fig. 16 Create a plot option
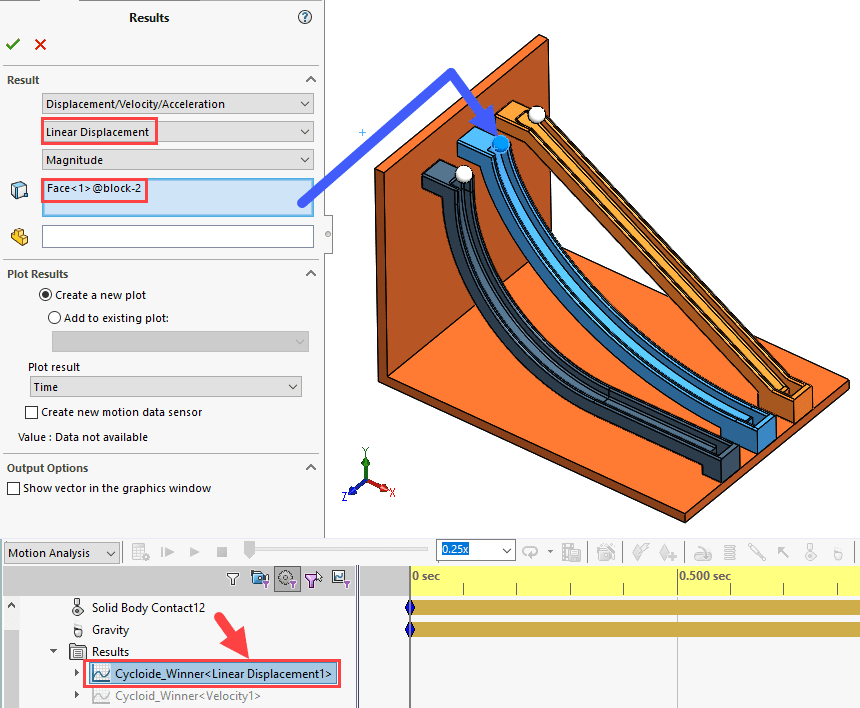
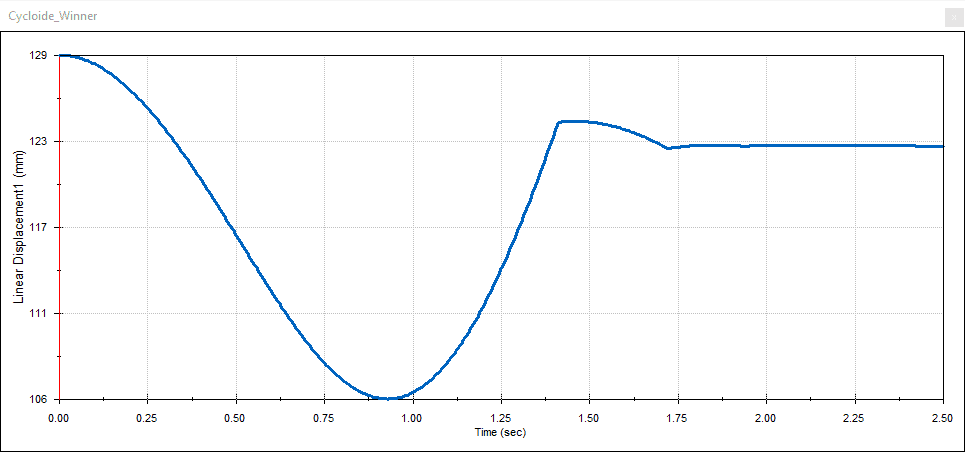
Fig. 17 Linear displacement plot setup and graph plot
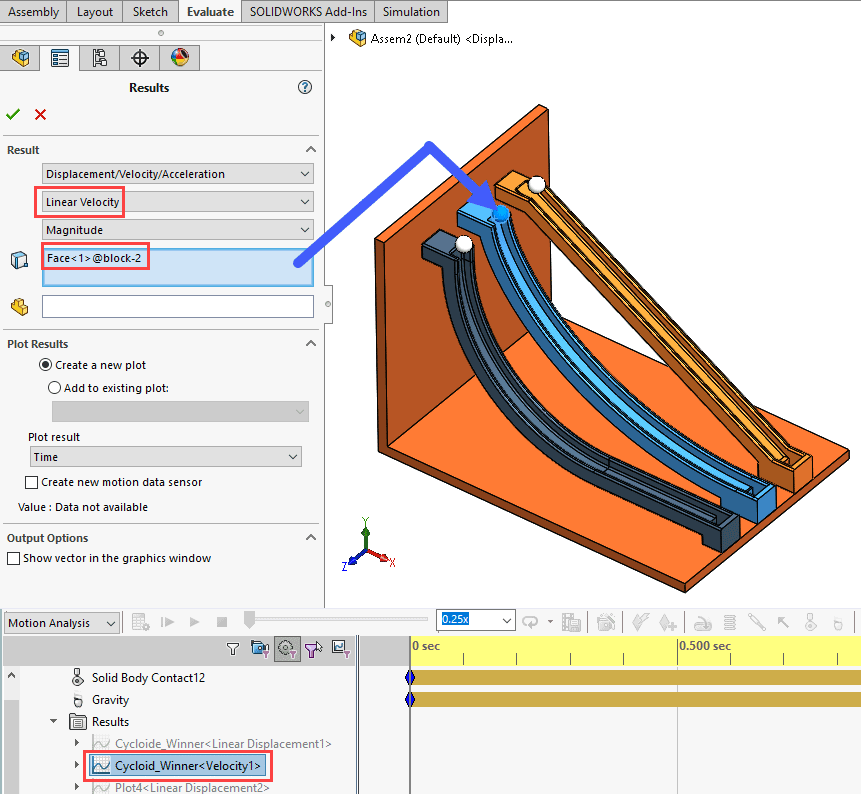
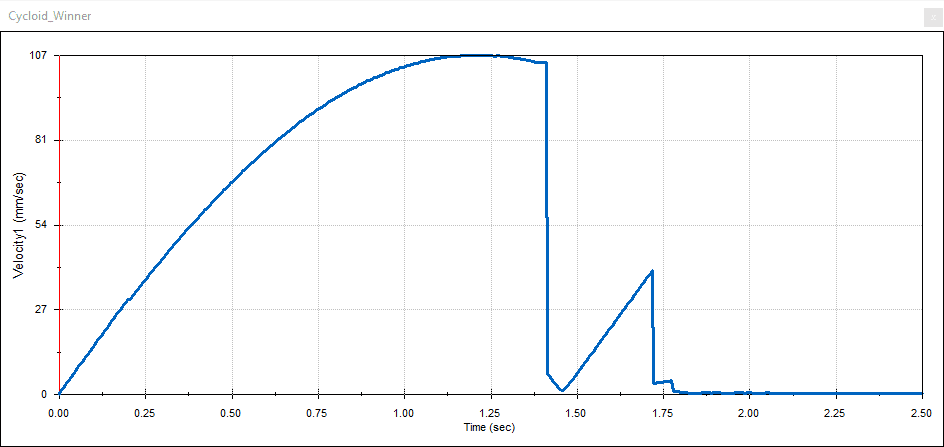
Fig. 18 Linear velocity plot setup and graph plot
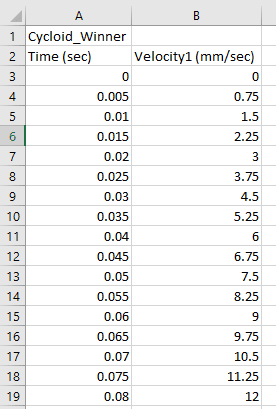
Lastly, you can save the graph plots in CSV file format to be used in Excel. See Figure 19 below.
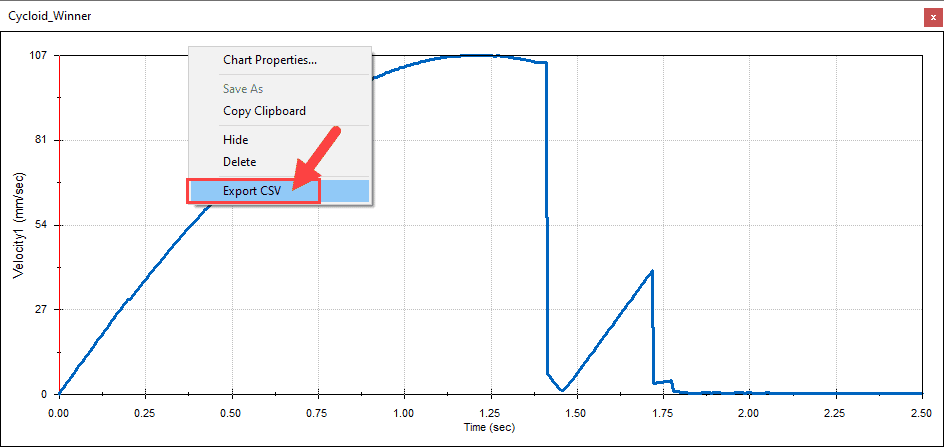
Fig. 19 Results from each study type
Final Thoughts
I hope you found this blog useful in learning what the Brachistochrone Curve is, a bit of the history behind it, and how to create your own model in SOLIDWORKS and then use learning how to use SOLIDWORKS Motion analysis to prove the theory. I know I did!
For more information reach out to your friendly CATI account manager. Check out the CATI YouTube page, and additional Simulation Blogs on the CATI blog.
Nick Pusateri
Senior Application Engineer Specialist, Simulation
Computer Aided Technology

 Blog
Blog