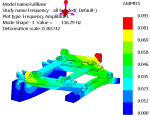
Natural Frequency Analysis
Natural Frequency analysis in SOLIDWORKS Simulation allows us to efficiently investigate the resonant frequencies of a design. This analysis type helps us ensure that the natural modes of vibration are well away from environmental forcing frequencies that a design might encounter during service. Like all analysis work, effective post-processing of your Natural Frequency analysis is key to communicating results to others. The standard output of a Natural Frequency analysis are the resonant frequencies and associated mode shapes of the design, which we can easily plot in SOLIDWORKS Simulation.
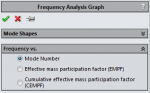
In SOLIDWORKS Simulation 2015, there were three additional frequency plot options added that are beneficial to conveying your Natural Frequency analysis results. Those plots, or Frequency Response Graphs, are Mode Number, Effective Mass Participation Factor (EMPF) and Cumulative Effective Mass Participation Factor (CEMPF). You can create these plots by right-clicking on your Simulation Results folder and choosing the option “Define Frequency Response Graph…”.
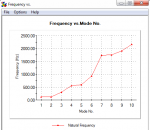
The Mode Number plot shows a graphical representation of the natural frequencies calculated by the analysis. This is a step up, in my opinion, from the simple list that is provided by right-clicking on the Simulation Results folder and choosing the option “List Resonant Frequencies”.
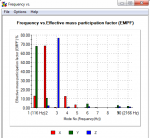
The second frequency response graph, Effective Mass Participation Factor (EMPF), helps us visualize how the mass is vibrating in X, Y and Z, for each natural frequency.
The third frequency response graph, Cumulative Effective Mass Participation Factor (CEMPF), helps us visualize the accumulation of mass participating in vibration as we calculate an increasing number of natural frequencies of our designs.
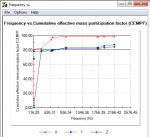
The EMPF and CEMPF plots are especially important when we are calculating Natural Frequencies of a design that will be subject to time dependent loads during normal product use. I plan on using these plots as I begin working on dynamic studies when investigating product performance subjected to random vibration or harmonic loading conditions.
Be sure to check out the three new Frequency Response Graphs in SOLIDWORKS Simulation 2015 to see how they can improve your Frequency Analysis post-processing. Now go make your products better with SOLIDWORKS Simulation!