SOLIDWORKS 2018 What’s New – SOLIDWORKS Flow Simulation – #SW2018
SOLIDWORKS 2018 What’s New – SOLIDWORKS Flow Simulation – #SW2018
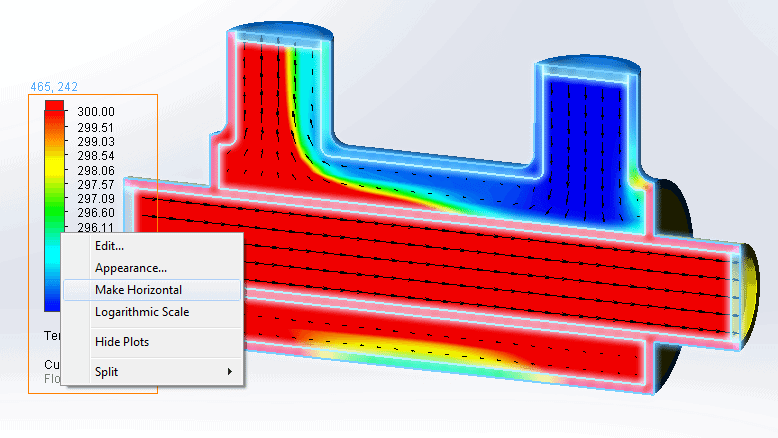
Graphical plotting of results in SOLIDWORKS Flow Simulation has been enhanced. Now we can use either a vertical or horizontal orientation of the color bar. Also, the scale of values displayed can be shown as logarithmic.
In the right-click menu on the color bar, you’ll find the option “Make Horizontal”. Also, notice the option to switch to a logarithmic scale.
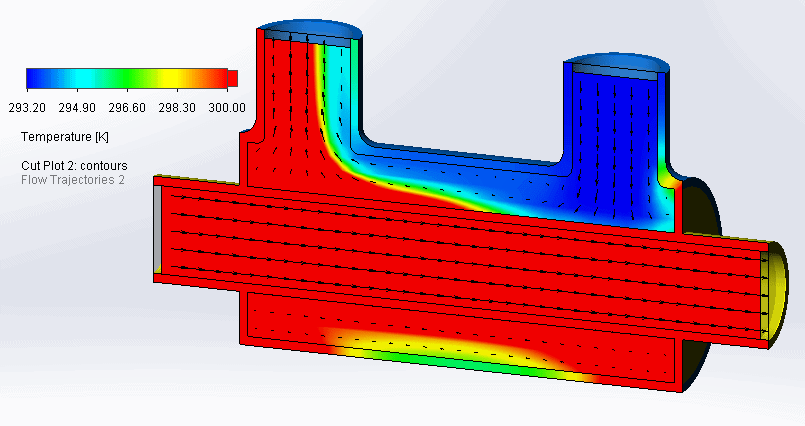
Here’s the result of switching to a horizontal orientation for the color bar on this cut plot showing temperature.
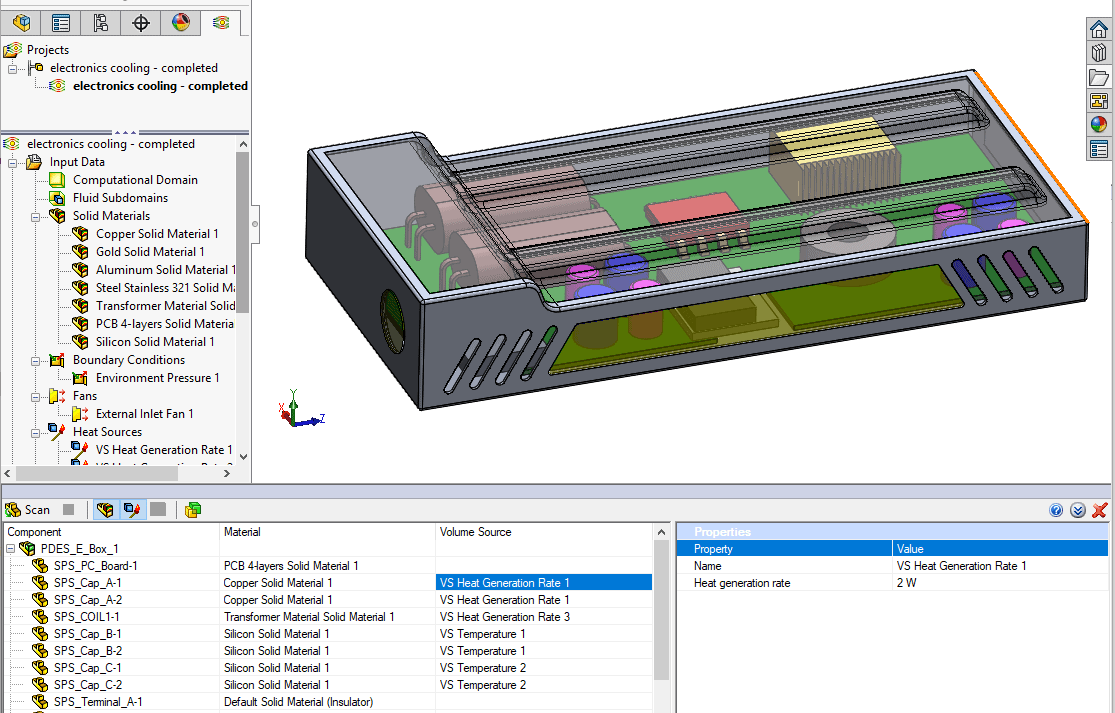
Another enhancement that is expected to make it into the PR1 release of #SW2018 is related to the Component Explorer, shown below. In SW2018 PR1, you will be able to create and edit sources and materials and display total power, directly from the table.
I hope this part of the What’s New series gives you a better understanding of the new features and functions of SOLIDWORKS 2018. Please check back to the CATI Blog as the CATI Application Engineers will continue to break down many of the new items in SOLIDWORKS 2018. These articles will be stored in the category of “SOLIDWORKS What’s New.” You can also learn more about SOLIDWORKS 2018 by clicking on the image below to register for one of CATI’s Design Innovation Summits.
Kurt Kurtin
Technical Manager – Simulation and Electrical Products