SOLIDWORKS Simulation: Result Plot Tips
The SOLIDWORKS simulation solved successfully! It must’ve been setup correctly or else it would’ve given an error and, even better, my max stress is below yield! Next problem, please. Pump the brakes! Neither of the statements you just read are indicators of a successful stress study. When the study solves our job, as analysts, this is just beginning. We must analyze the results plots to confirm that the stresses we see are real and not stress singularities and we must validate our inputs (material, geometry, fixtures, loads, mesh density). All real stresses converge to a specific value for each iteration of the stress analysis. Stress singularities do not converge and so are false.
Several factors have influence over how we view the results and which results plots we create. One factor is mesh type. There are three mesh types, shell, beam, and solid. The assembly below must be analyzed and the geometry will determine which mesh type we use. Long bodies with consistent cross section are beams, thin bodies with consistent thickness are shell, and all other bodies will be solid.
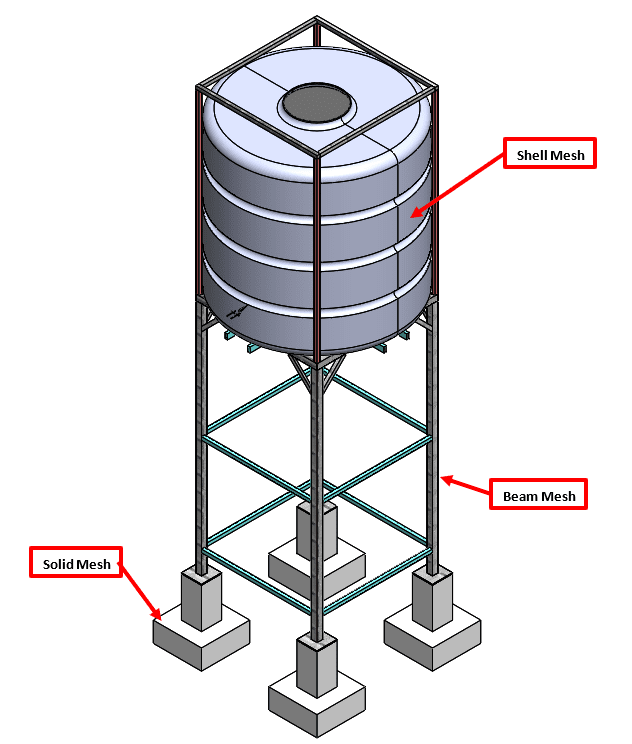
The mesh type plays a significant role in the result plots. Bodies meshed with shell elements have no thickness, and beam elements model the geometry with a single line. We fully defined a simulation study for the assembly pictured above; now let’s look at the result plots!
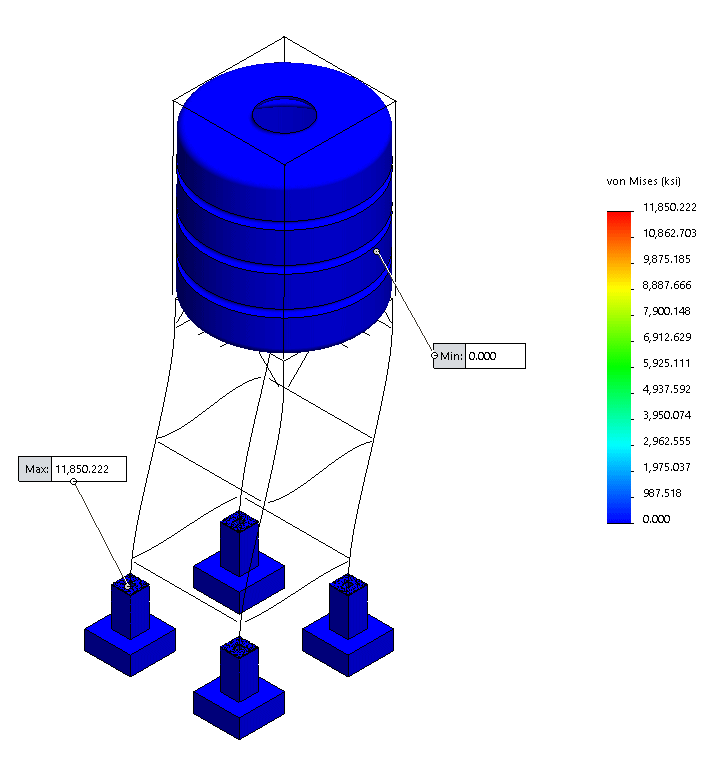
The plot above is the stress plot. At first glance, this plot does not appear to be very useful. All the parts are solid blue except for the structural members which are missing altogether! Let’s address the stress contour (or lack of) first. The max stress is listed at nearly 12,000 KSI, or 12,000,000 PSI. This result strongly indicates that a stress singularity exists in the model and, consequentially, the true maximum stress is not 12,000 KSI. The Hot Spot Diagnostic tool helps to determine if there is a stress singularity and, if there is one, where the stress singularity is located.
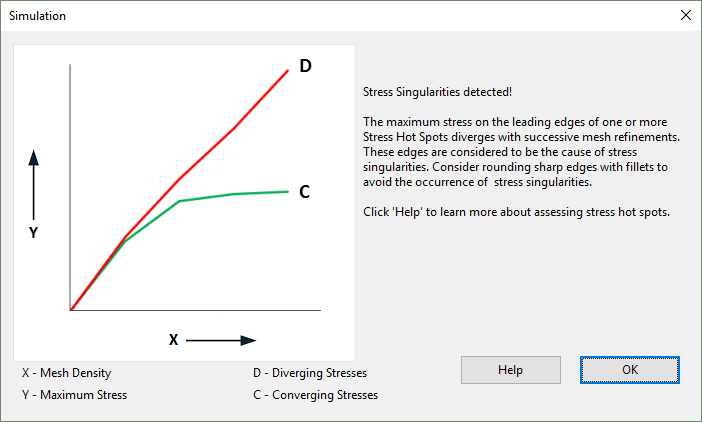
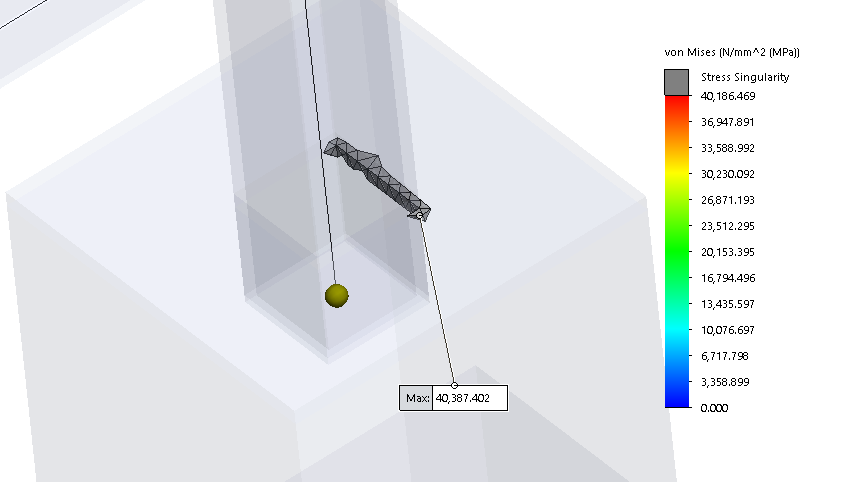
Notice the words in this pop-up window “stress singularity detected”. And below is a screen capture showing where the stress singularity was found.
I changed the scale of the stress from a maximum of ~12,000 KSI to a max 35 KSI (34.9 KSI is the yield stress for this steel material) and now we can see a stress contour (see below).
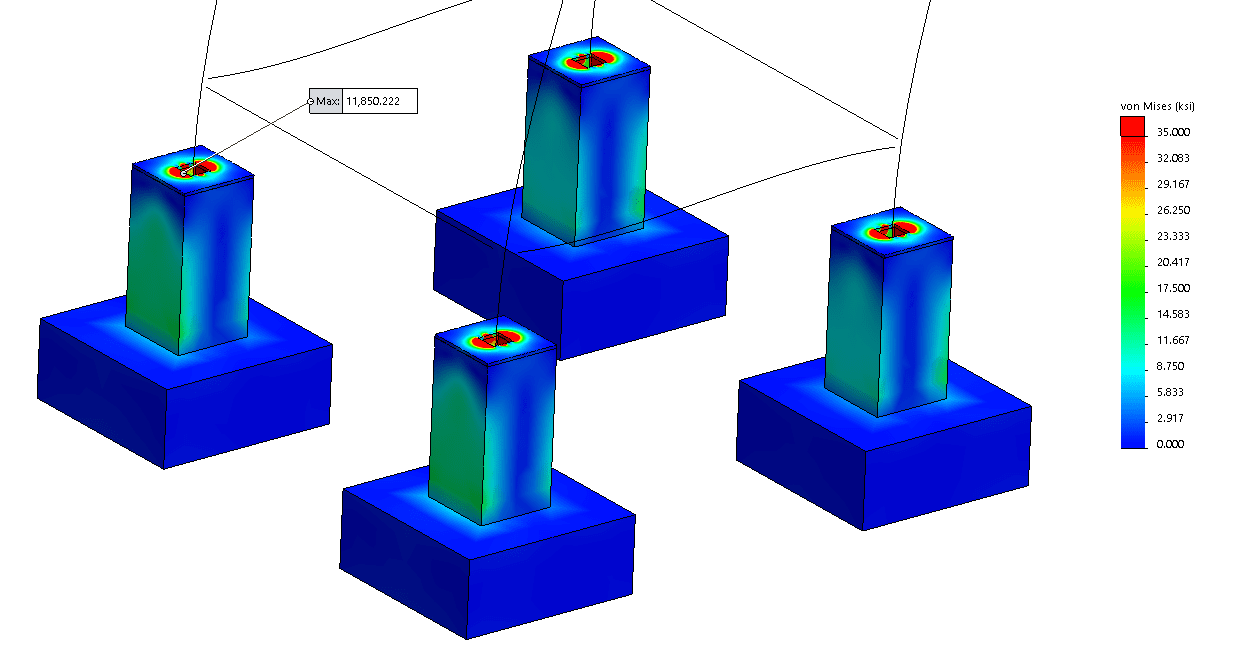
The red color indicates 35 KSI, which is the yield strength. We conclude from this stress plot that the assembly has some localized yielding based on the fixtures and loads applied. It’s worth mentioning that if we applied unrealistic fixtures or loads, then nothing in this study is reliable. Up to this point we have only been viewing the stress on solid/shell meshed bodies. What about the structural members? Well we can view the structural member stress by right clicking on the stress plot, selecting edit definition, and checking the box for beams.
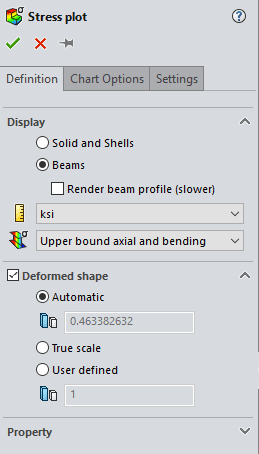
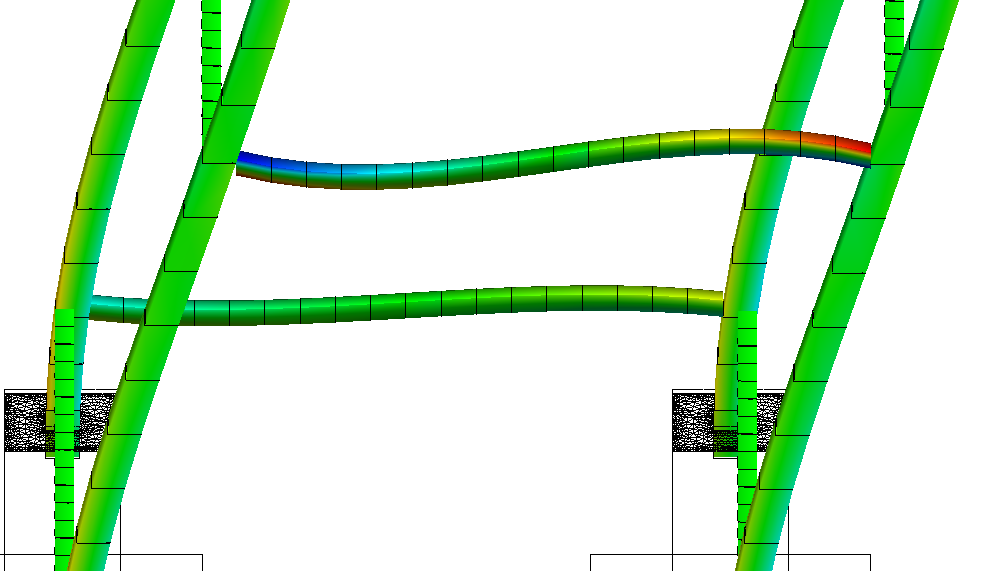
You guessed it! We cannot view beam stresses along side solid and shell stresses. For solids and shells we look at stress like Von Mises, normal, shear, etc. Beam stresses are shown as axial, bending, and shear. Based on the different stress types available for beams, SOLIDWORKS keeps the beam stresses separate from the solid and shell. Upper bound axial and bending shows the maximum stress value through the cross section of the beam. Selecting Render beam profile will enable the user to view the stress through the cross section (see below).
In most studies there are sections/bodies with more stringent strength requirements than the other sections/bodies. In SOLIDWORKS simulation we have the option to view the stress results on only specific faces and/or bodies.
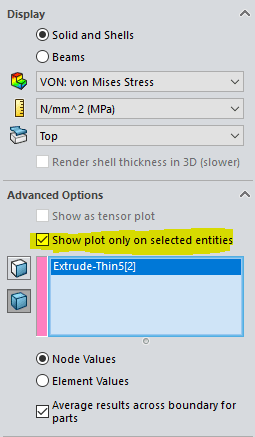
And we also have the option to change the scale to match the min and max stress on just the selected entities.
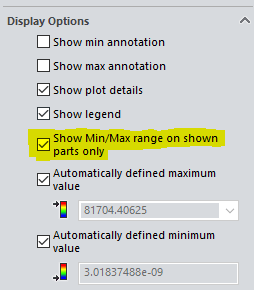
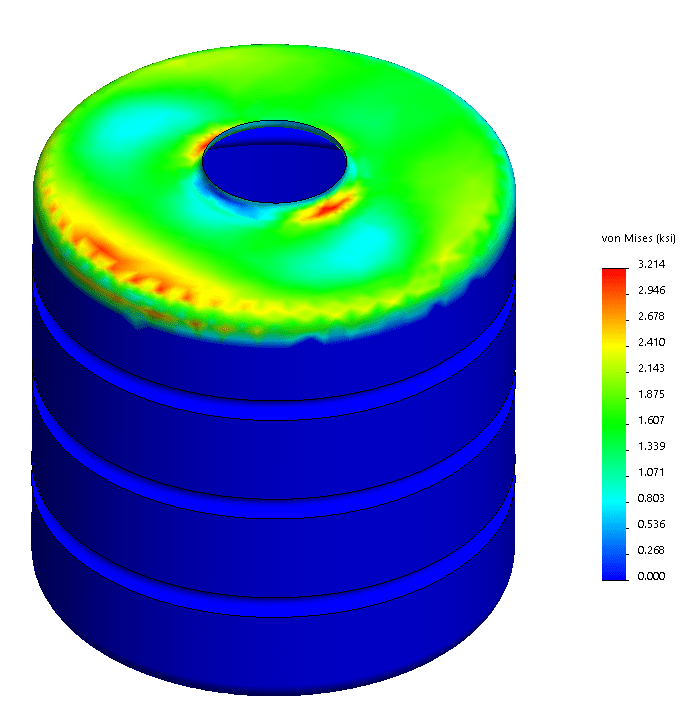
Min/max stress in KSI on the tank of the water tower.
The result viewing tips you have seen in this blog only represent a small subset of all the result viewing utilities that are available in SOLIDWORKS Simulation. I am unable to show the full extent of these utilities in a blog article. For a more complete instruction please consider enrolling in our Simulation training course.
Matthew Fetke