SOLIDWORKS 2017 What’s New: Stress Hot Spot Feature #SW2017
Stress Hot Spot Feature
Many people may not be experts in FEA or SOLIDWORKS Simulation. It is a complex topic that requires practice and know how to get realistic results. Fortunately for designers, SOLIDWORKS Simulation results just got a little bit easier to work with. SOLIDWORKS 2017 has released a new feature called Stress Hot Spot Diagnostics. What this tool does is shows and isolates elements that have much higher stress values than adjacent elements.
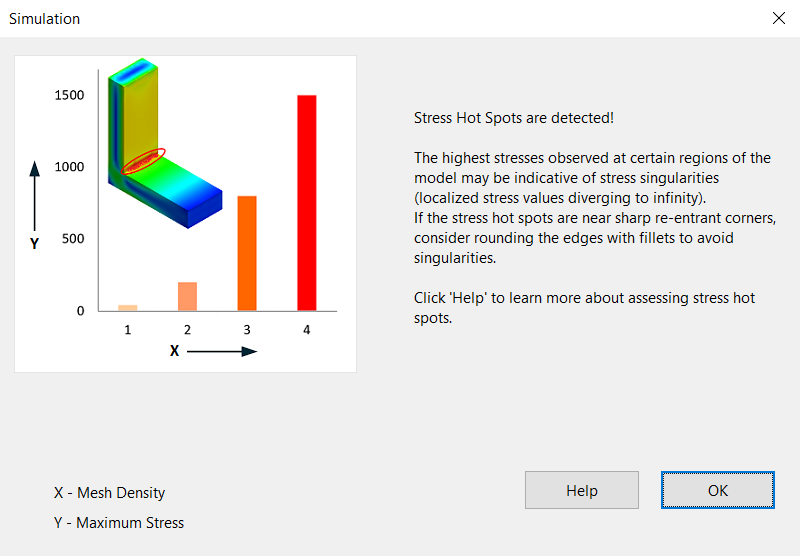
The mathematics of FEA analysis are limited in that when stress is calculated at a sharp corner, the value of stresses at that corner diverge to an infinite value as the mesh gets smaller and smaller there. Experienced FEA analysts know how to locate and mitigate factors that may cause this, but many designers using SOLIDWORKS Simulation for quick design validation may not be as savvy.
The Stress Hot Spot diagnostics tool allows designers to find the stress hot spots like an expert in no time at all!
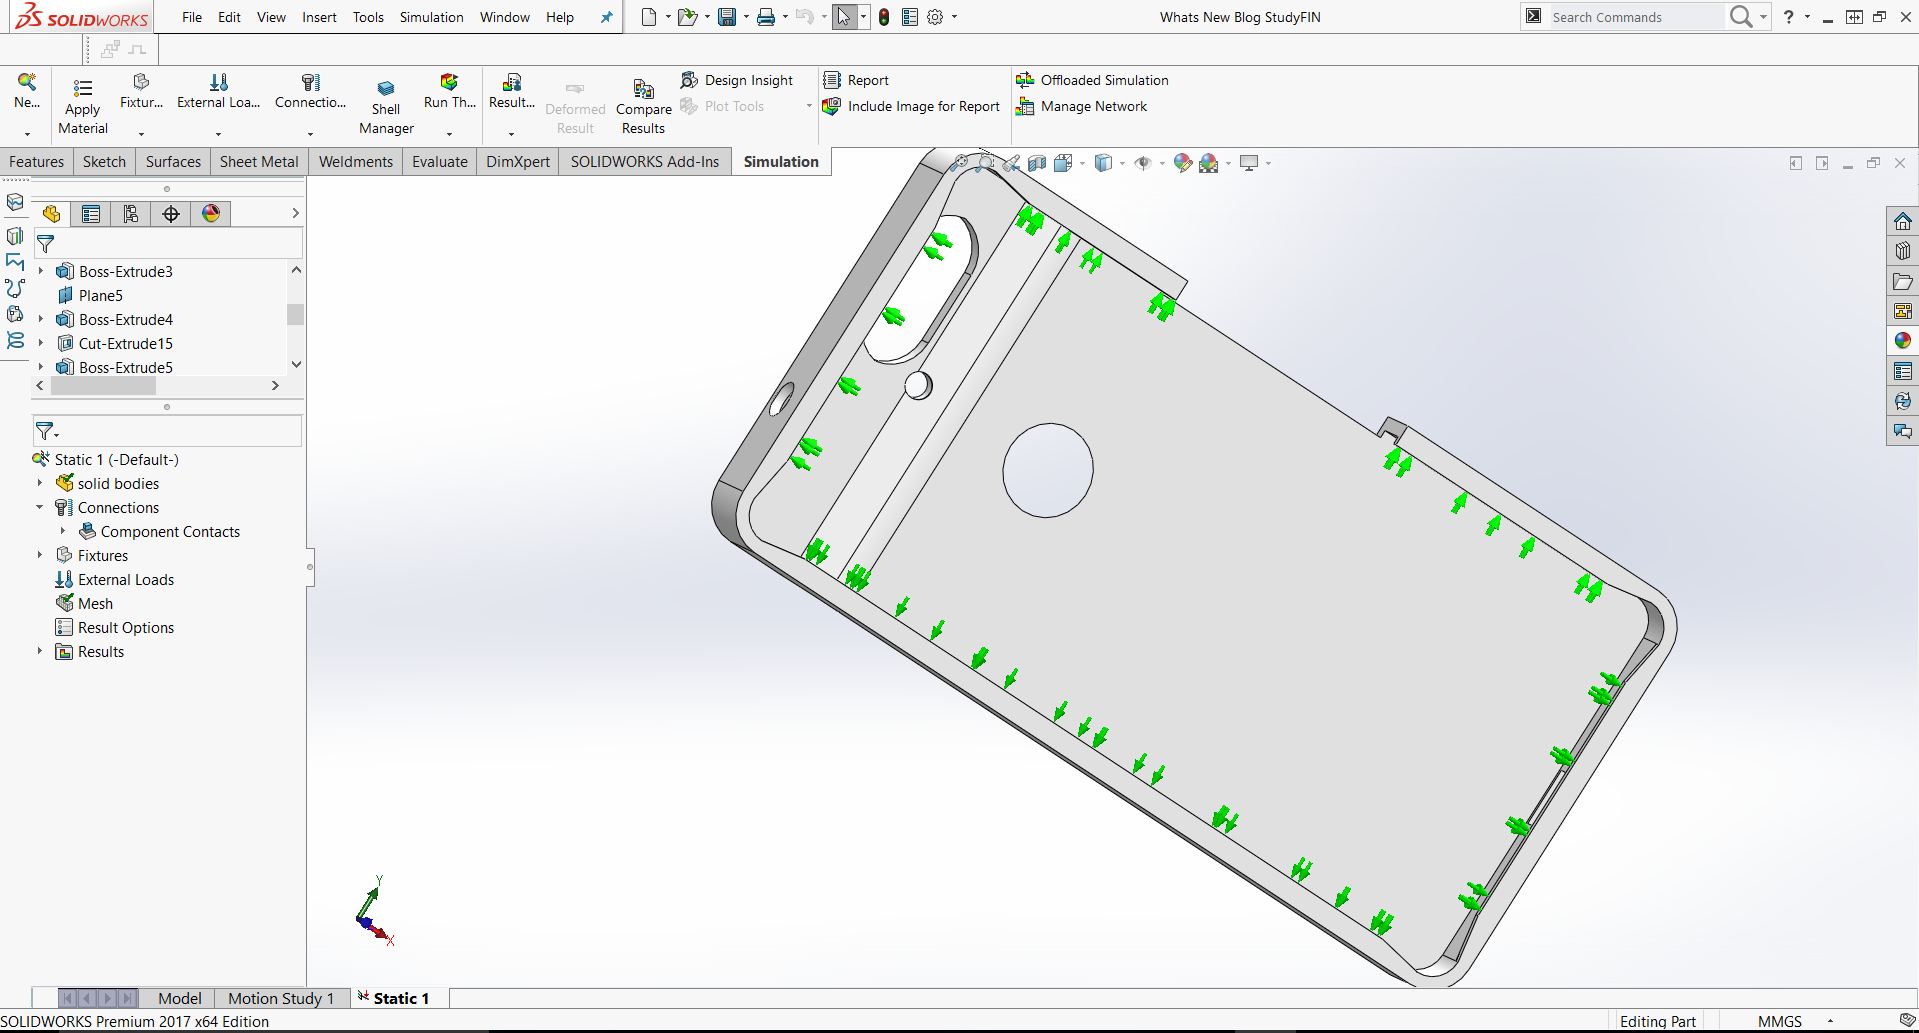
Let’s say that an engineering student in college invests in an expensive new phone, and wants to 3D print it at their school. However, before they go through with that, the student wants to make sure that the design will not break while inserting the phone into the case before wasting time or expensive print material. The student turns towards SOLIDWORKS Simulation to help him with that.
The student loads the phone case with a prescribed displacement of a “worst case” scenario for applying the case to the phone.
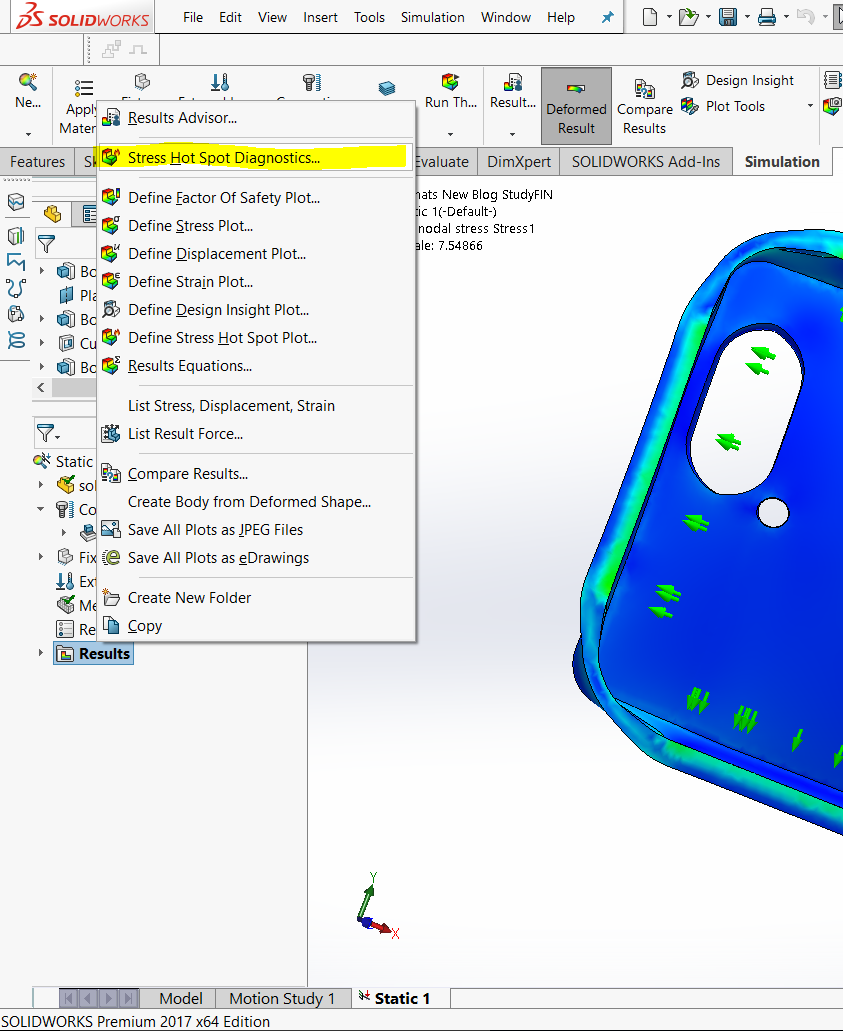
Next, the study is calculated to get the stress results. The results look like one would expect, but maybe not the most realistic. The SOLIDWORKS Simulation Stress Hot Spot tool is located by right clicking the results folder near the top of the menu.
Once the tool is open, the dialogue looks like this:
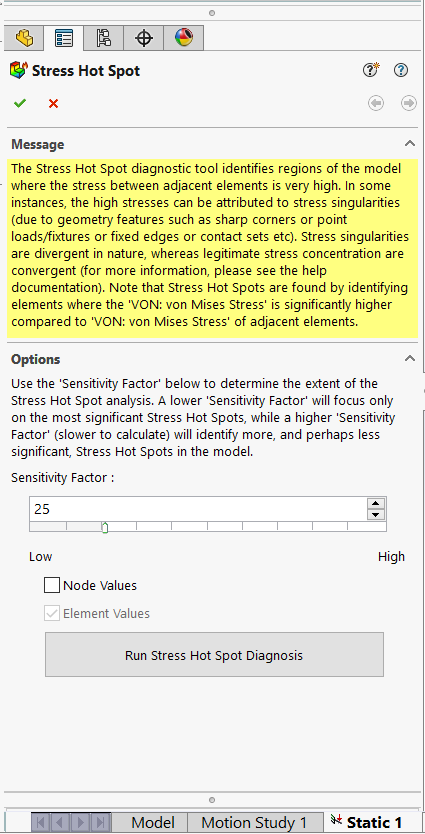
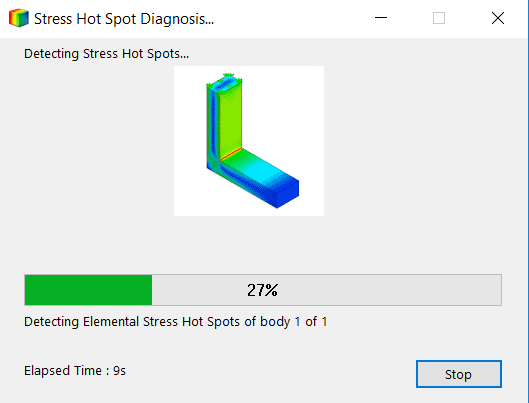
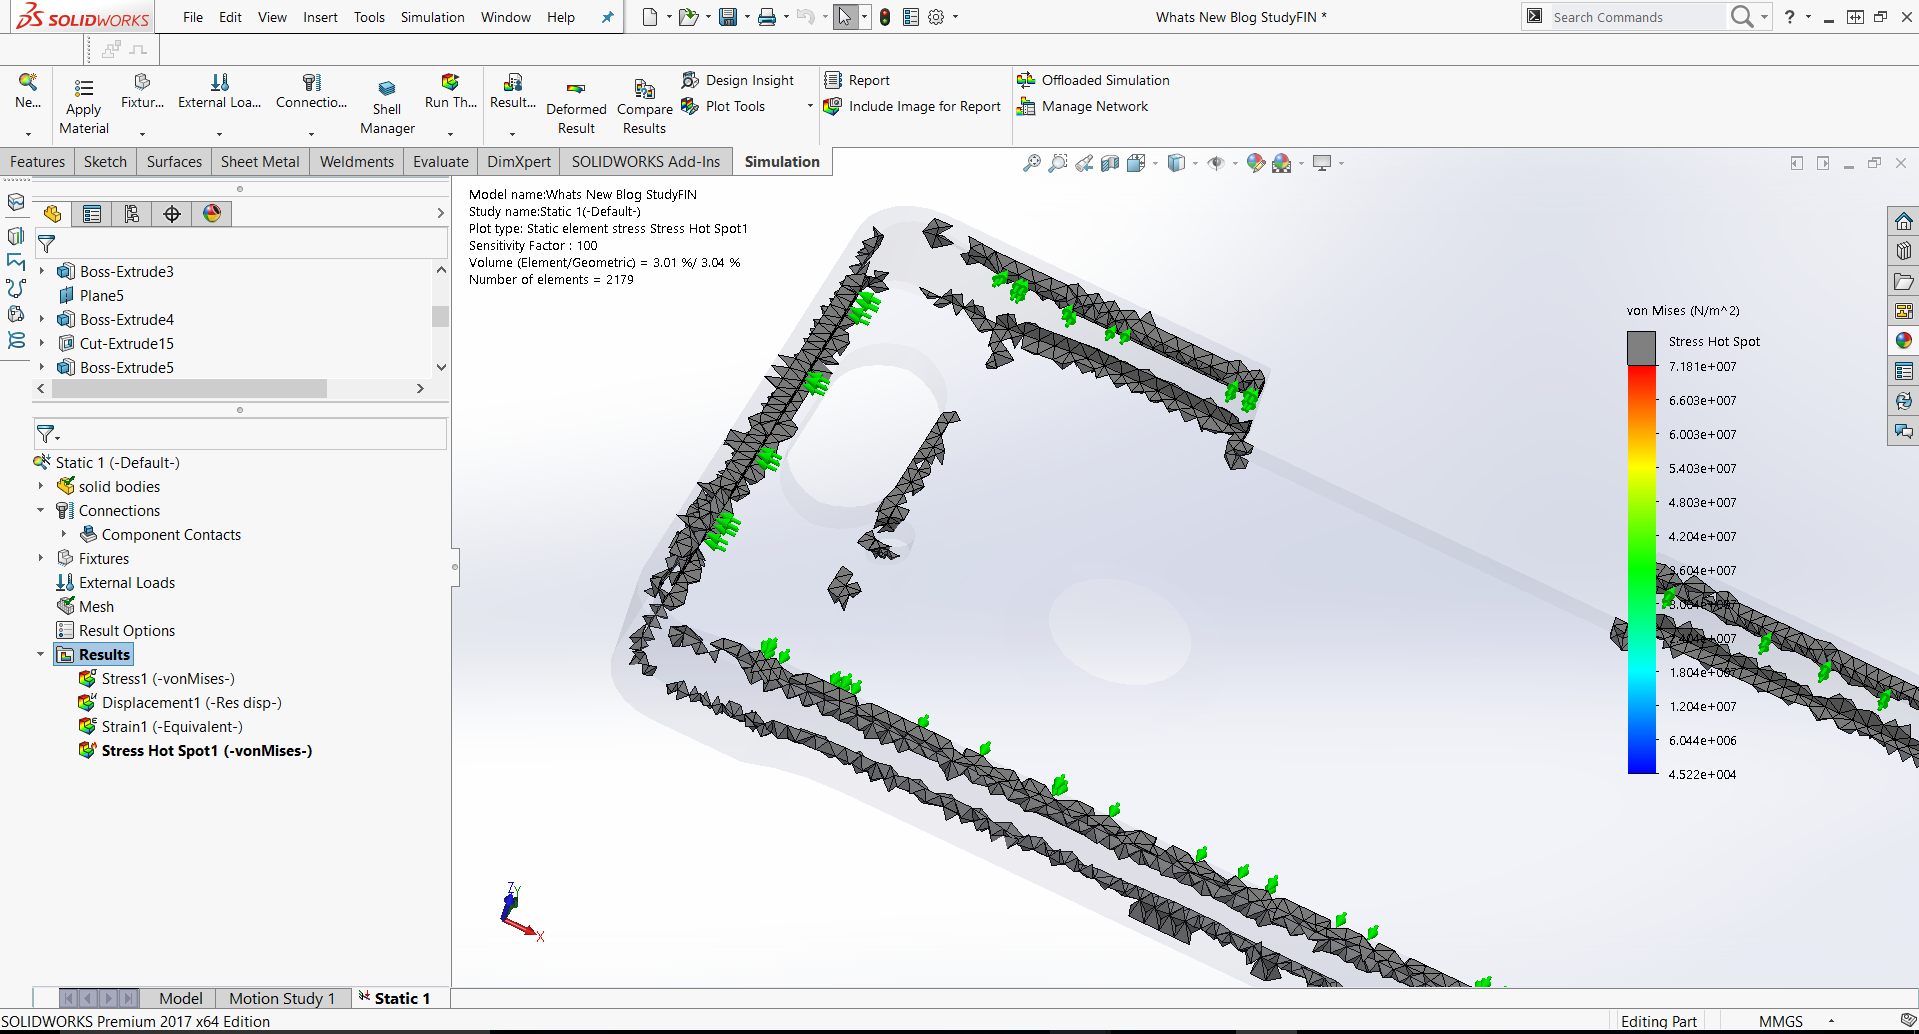
There are a few options for the tool. The sensitivity can be edited. It can also be used to read Node Values, but for the purpose of this study, element values should be fine. Once the sensitivity is set, click the “Run Stress Hot Spot Diagnostics” button. The two dialogue boxes then come up respectively.
After the Hot Spots are calculated, there are a few ways to visualize the plot.
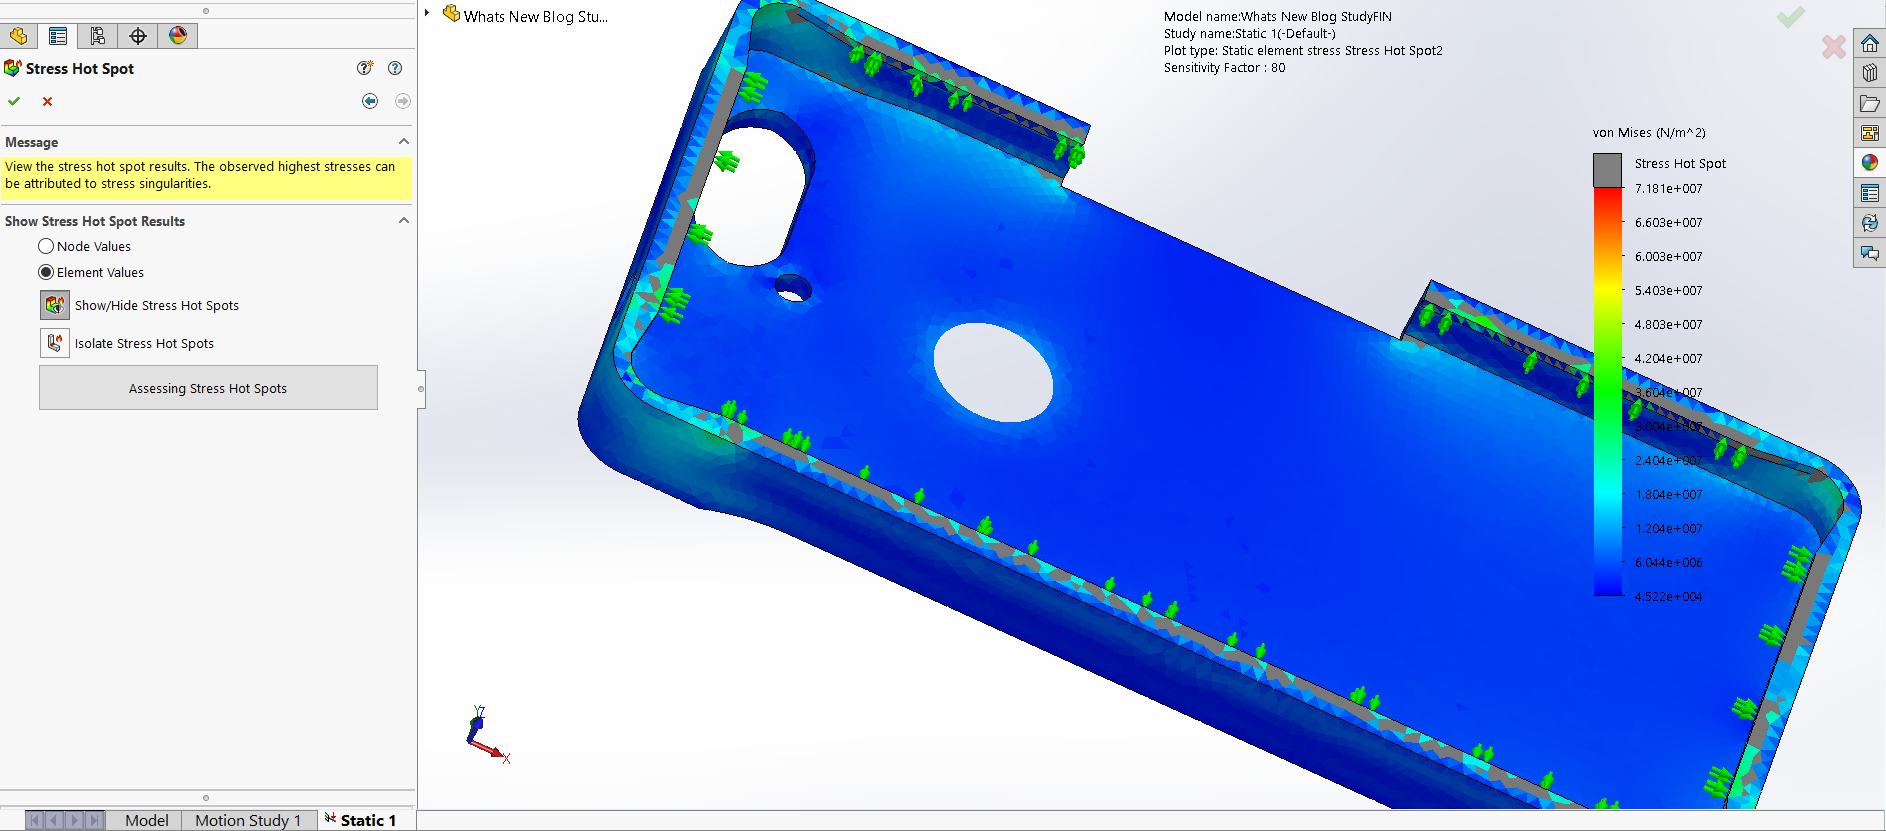
The “Hot Spots” are imposed in Grey over the model. There is also a plot to isolate these hot spots for elements that may be internal to the geometry. Below is what that comes up looking like.
As one would expect, most of the corners of the case come up as hot spots. These are areas where high stresses are likely to occur, but the values may or may not be realistic. The Stress Hot Spot tool shows the user areas that may require extra attention in the form of small fillets or other design changes. This makes it even easier for designers and those who are less experienced in Simulation to validate their designs effectively!
We hope this part of the What’s New series gives you a better understanding of the new features and functions of SOLIDWORKS 2017. Please check back to the CATI Blog as the CATI and MCAD Support Teams will continue to break down many of the new items in SOLIDWORKS 2017. All of these articles will be stored in the category of “SOLIDWORKS What’s New.” You can also learn more about SOLIDWORKS 2017 by clicking on the image below to register for one of CATI’s or CATI’s Design Summit’s.
Matthew Sherak
SOLIDWORKS Simulation Applications Engineer
Computer Aided Technology