Performance Evaluation with SOLIDWORKS Assembly
As Application Engineers we are constantly asked for “best practices” and usually it’s around the topic of SOLIDWORKS Assembly performance. Most of the time when people ask what they can do differently or are they following best practices, my answer is extremely robust….[Insert Shoulder Shrug].
Don’t get me wrong there are certainly some best practices that can be followed like don’t work with errors in the Design Tree or mating to common surfaces, but honestly a fair number of users already practice those types of best practices. The real question people are asking is how do I understand the performance of MY assembly? And to that question my initial response is [Insert Shoulder Shrug].
Luckily there is a way to review assembly performance. With Performance Evaluation within assemblies you get a whole host of great insight into performance of your assemblies and where to start if you want to improve the performance. Once you have opened a fully resolved assembly, go to Tools > Evaluate Performance Evaluation.
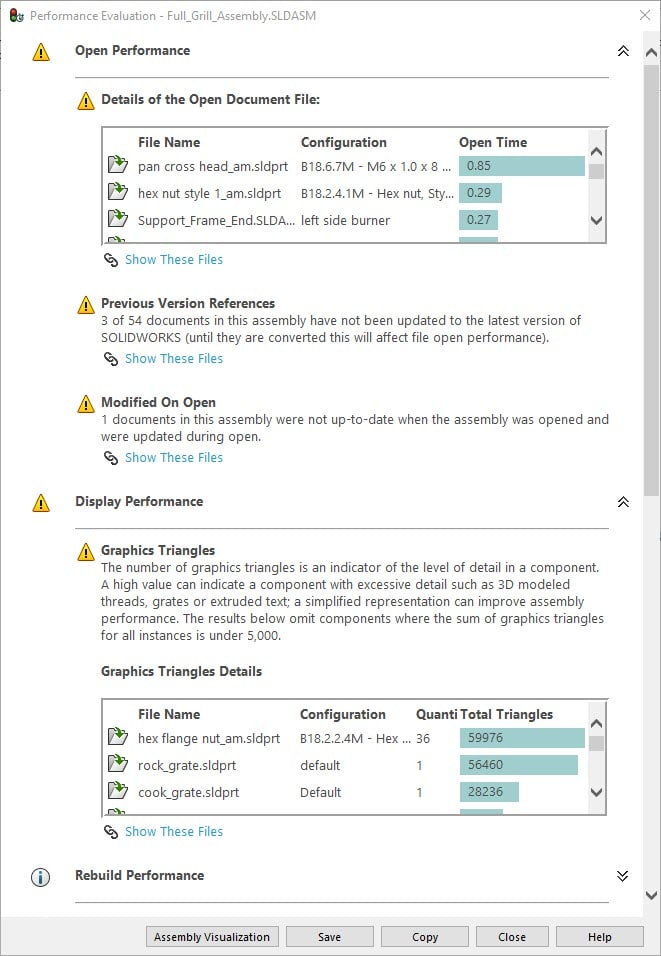
The first section is Open Performance which walks through some handy information including Open Times for the parts of the assembly, files that are saved in a previous version of SOLIDWORKS that should be updated, and any files that were modified during the open (i.e. some reference from the assembly required they be updated, like a hole position).

I believe the two most important areas to focus on in this section are the number of previous version files and modified on open files. For previous version files that performance fix is really easy, simply open and save those files in the latest version of SOLIDWORKS so you don’t take the performance hit every time. And for the modified on open look to the files listed to see if their modification makes sense. Meaning, should those files need to be updated relative to the assembly. So for example if there are assembly level features that are putting holes in parts, then yes those files should update on open. Often times performance losses come from unintentional design intent across parts in an assembly.
The next section is Display Performance which shows the number of graphics triangles per file multiplied by the number of instances for Total number of triangles contributing to the overall graphical display. You will also see if there are parts that have the Image Quality set too high.
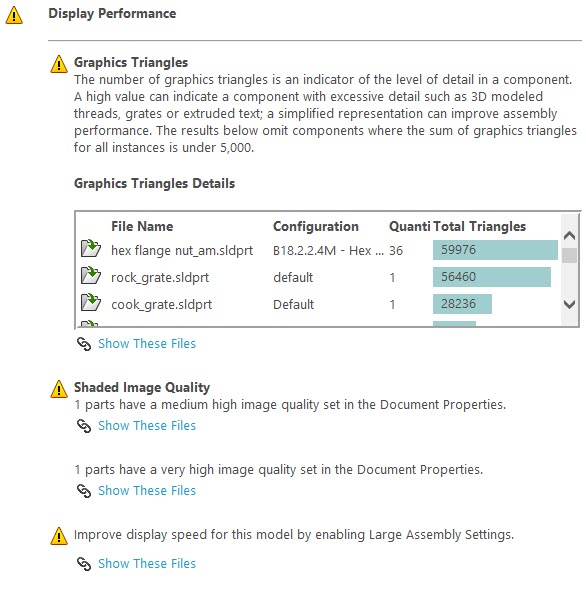
This section often provides the biggest bang for your buck with information for where to improve on assembly performance. It highlights easy fixes like adjusting image quality on parts by going to Tools > Options > Document Properties > Image Quality and moving the slider bars down. And this section helps highlight parts that are likely to be complex designs that likely could benefit from some simplification methods at the top-assembly through the use of tools like Defeature.
The next section is Rebuild performance which shows helpful information regarding circular references, number of mates, and an assembly rebuild report.

The key for this section is the Circular References. Circular References are certainly a bad practice and can cause significant performance problems, so finding where these problems are is the first step to removing them from your assembly.
The next section is Settings Performance which will highlight if any of your current settings are contributing to the overall performance of your assembly.
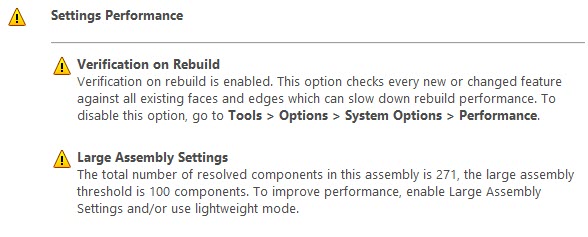
While somewhat helpful, this section rarely leads to significant improvements because the settings that are being used for the evaluation may necessary for the design, i.e. verification on rebuild. However, it does provide a friendly reminder to consider Large Assembly Settings or Large Design Review if your thresholds have been passed on your settings (Tools > Options > Assemblies > Opening a large assembly.
The last section in the Performance Evaluation is Statistics. The statistics provide some key insight to the overall number of parts, bodies, mates, sub-assemblies, mates, flexible subassemblies, mates, resolved components, mates, and oh yea did I mention total number of mates?
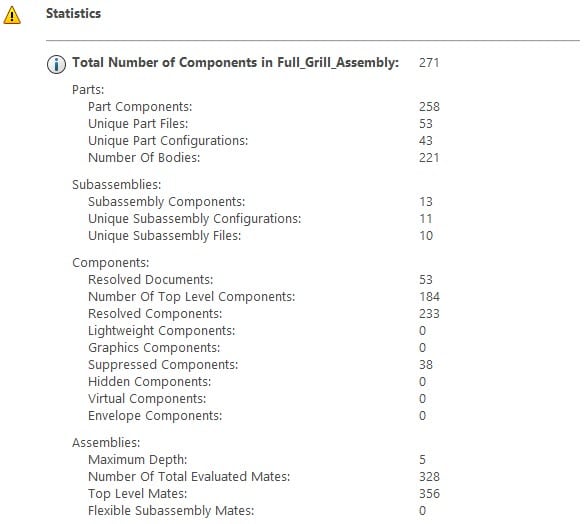
This information is really key to help understand how to improve overall open and performance of your assemblies. The greater the complexity of any top-level assembly the longer it will take to open and the slower it will be to work with. To improve overall performance, it’s necessary to try and reduce the number of mates through the use of various strategies like creating sub-assemblies or using lock-rotation for hardware instead of adding an extra mate or using assembly patterns.
At the end of the day, the most important takeaway to consider is that performance is all relative. Really try to think about the problem that’s being solved and is the performance satisfactory given the problem we’re tackling. If we’re working on an extremely complex piece of equipment that has a lot of references from one part to the next the assembly will be slower, but if I’m creating designs that I know are accurate (i.e. all the holes line up for the laser cuts!) I’m willing to be more understanding of open times and overall performance.
Brandon Nelms
Application Engineer Manager
Computer Aided Technology, Inc.