Back to the basics: Farming Intelligence on the 3D Experience Platform
This blog is a follow up to my previous blog on navigating the 3D Experience Platform. You can find that blog linked here. In the previous blog we used the analogy of being a primitive hunter gatherer to the process of beginning work with the 3D Experience Platform. We looked at several ways to find and organize data on the platform, but we only made it so far. To carry on with my analogy, we have only barely made it past a data “hunter gatherer.” I’d like to continue our journey, using some neat tools on the platform to increase our data agriculture and farm some intelligence into our business.
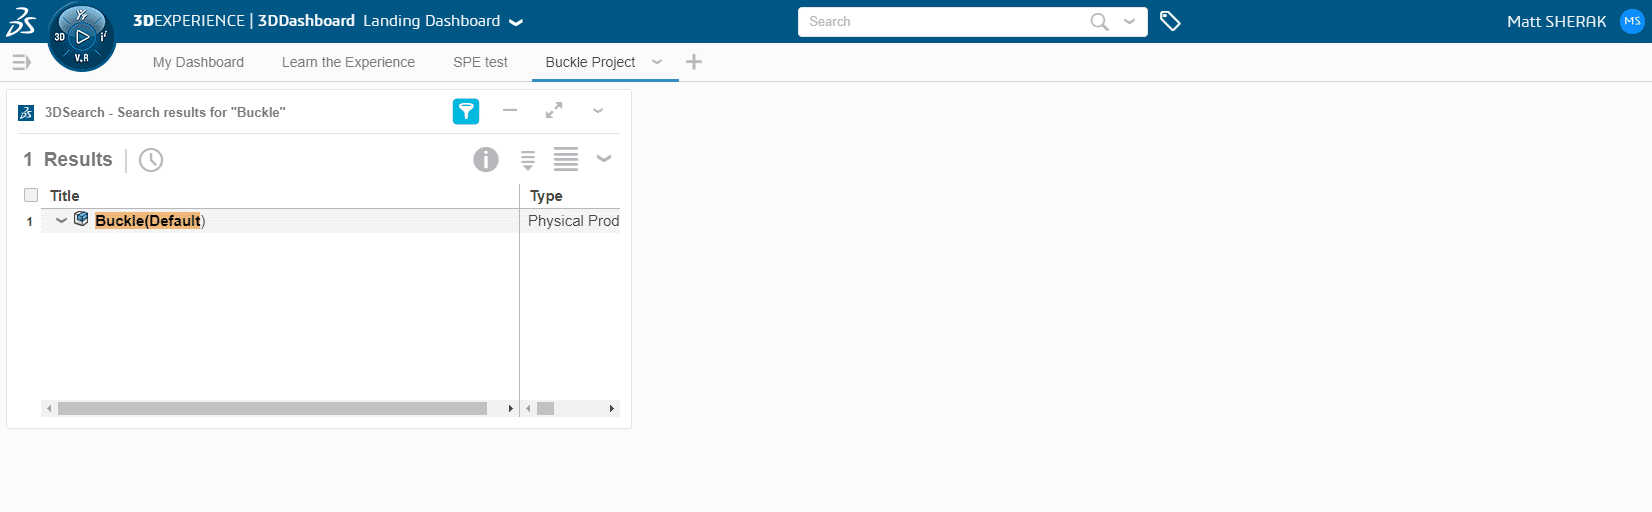
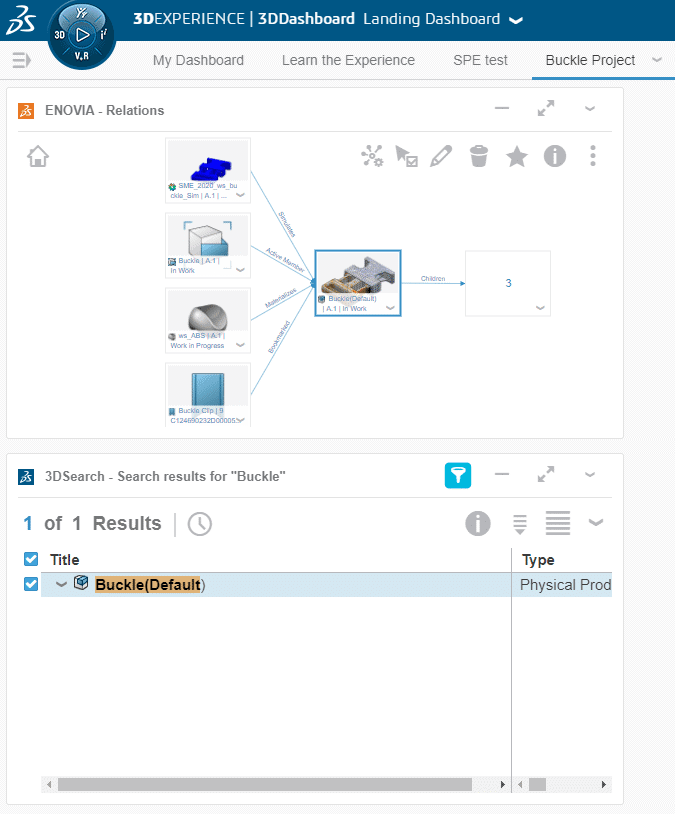
We left off with a nearly blank dashboard containing only a 3D Search widget that returns the Physical Product for our Buckle clip geometry.
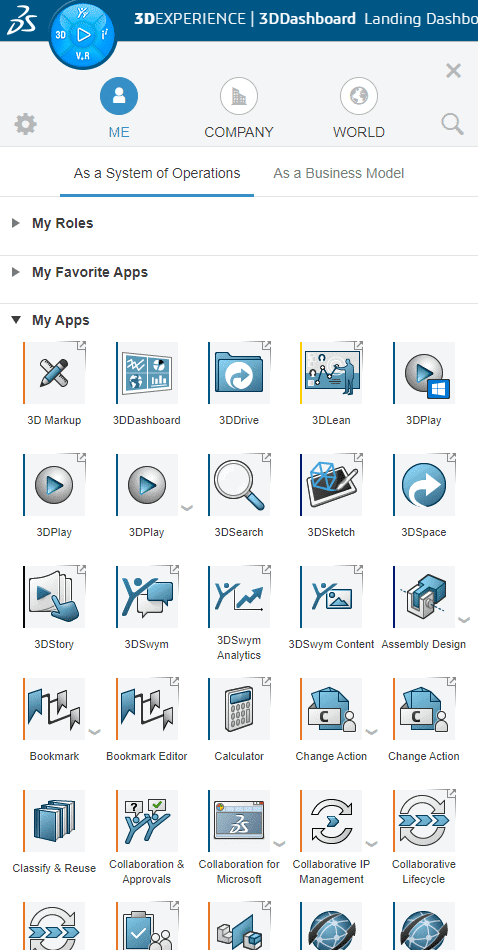
Our plan here is to use this 3D Search widget as a seed to begin sowing our crop. First, I think we need to differentiate a “widget” app from the others. Anyone with a smartphone is probably familiar with widgets, but they are just lightweight versions of apps that are meant to show small snippets of data. In our case, the 3D Search widget just shows the result of a previous search. You can open the apps list by clicking on the compass in the top left. The apps available to you will change based on what roles have been assigned to you. Here is a look at mine.
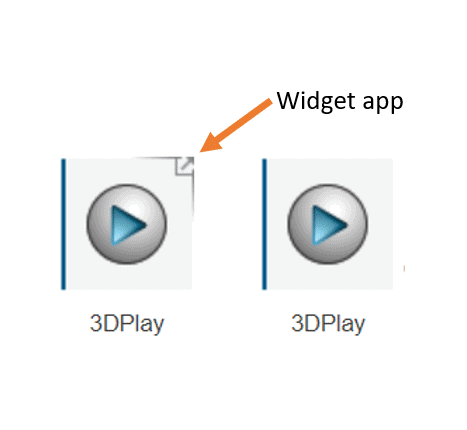
Many apps in the list will have a small arrow in the upper right corner. That arrow indicates that the app is a widget app and can therefore be dragged onto any dashboard tab.
There is nearly unlimited possibility of what you can do with these widgets. For our Buckle project, I’ve run a simulation on it, and I’d like to share those results with my manager. I like to use the Enovia Relations app to view associated parent and child relationships to the Physical Product I am working with.
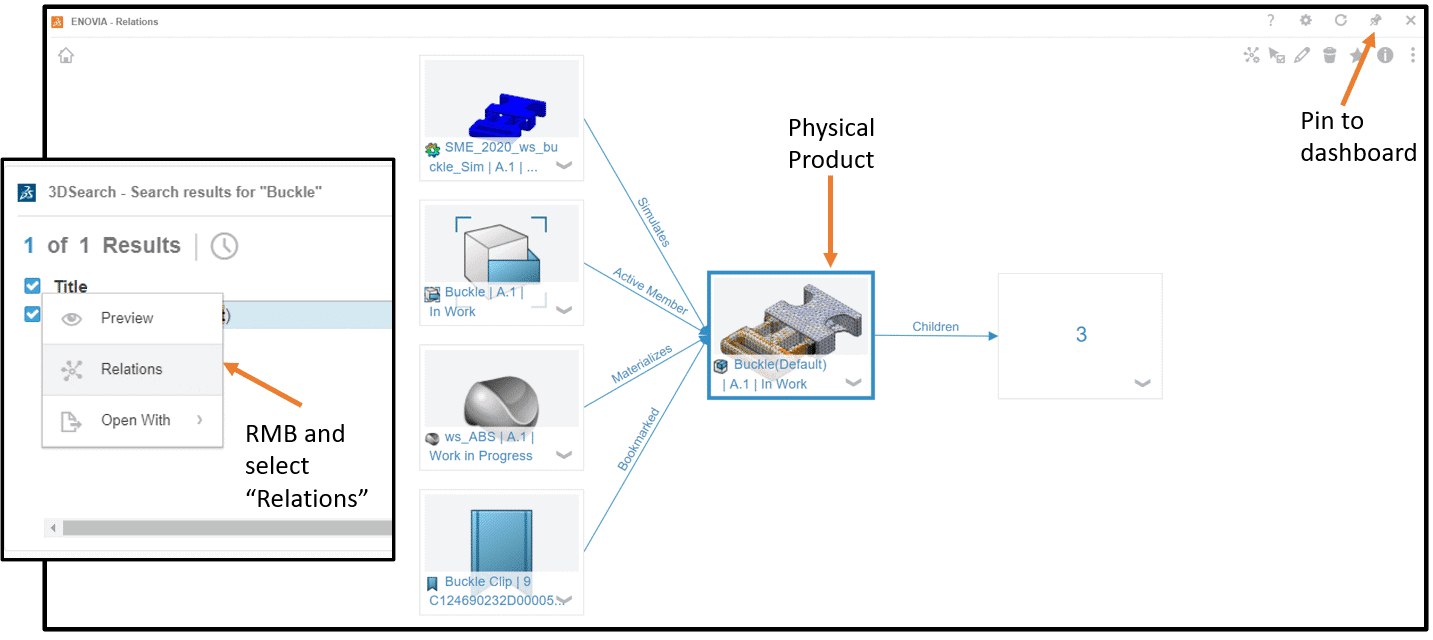
This app is accessed by right clicking the Buckle part and selecting relations. It will show your Physical Product as well as any simulations, 3D shapes, materials, metadata, child relationships, etc. All of this is displayed in an easy-to-understand graphical interface. Pinning this window to the dashboard is as easy as clicking the button and will make it easy for me to use the associated files later.
So now, we have a good start to our data crop for this project. All we must do now is fill the rest of the dashboard with things that make communication easier. I am a visual person, so I like to have a graphical representation of the model I am working with. This is easy to do with the 3D Play widget. I can simply click and drag the widget as seen above onto our bank dashboard. Then we just drag the Buckle Physical Product into the blank space on that app. See short .GIF file below:
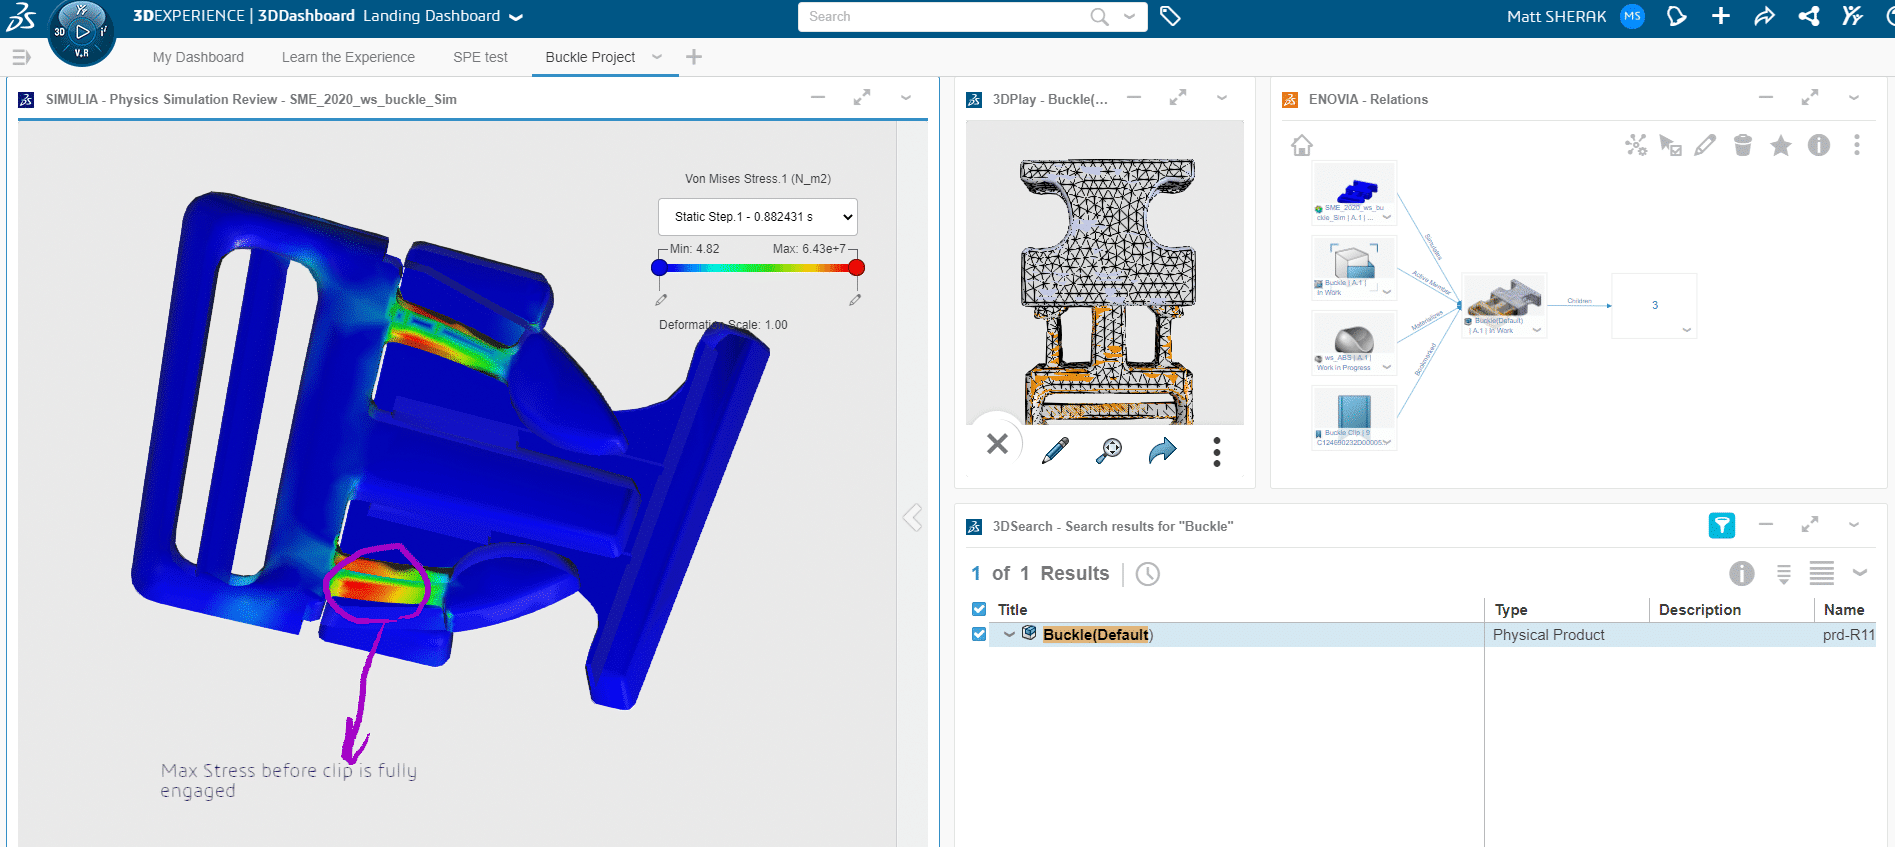
The 3D play app is great, it allows us to see the CAD model and the associated FEM representation. It is also an interactive widget; I can zoom, pan, rotate, take measurements, and even do section views from here – all within an internet browser window! As you can see, all the widgets are easily moved and resized by the handles and the corners.
Now that we’re comfortable with dashboard customization, we can drag, drop, resize and customize to our heart’s content! I want to communicate the stress profile of this buckle clip at its maximum point. We can accomplish this with the Physics Simulation Review widget. It works similarly to the 3D Play widget; we can do animations, section views and other lightweight simulation post- processing functions.
Finally, we’ve sown our crop, now it’s time to share the bounty of the harvest. This is the real power of dashboards. Everything we have done here can be shared with anyone else on the platform! In this case, I will share it with my boss Robert for his review.
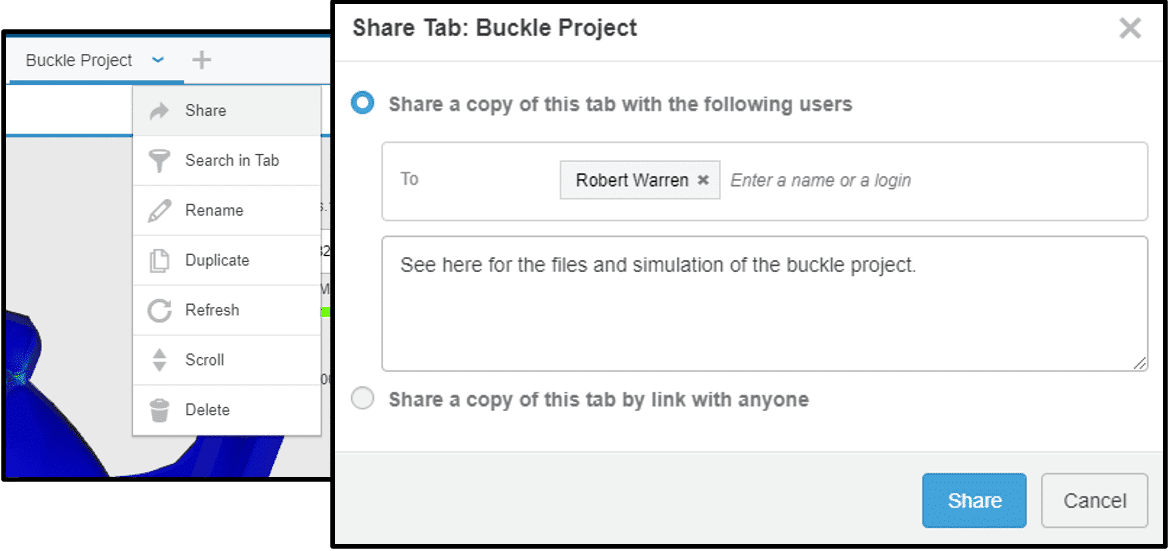
Once he opens this dashboard his view will look identical to mine, but from there he can add new widgets and annotations, move the product along the product lifecycle, open files, or even tweak it to his own liking, and share the new version with someone else!
This is not the only way to share or organize data on the 3D Experience Platform, nor is it necessarily the best. This is merely how far my evolution has come, and I’m sure it will go much further. I’ll keep you up-to-date in future blogs with any new exciting advances I discover on my journey to become the most evolved platform navigator that I can be!
Matt Sherak CSWE
Applications Engineer, Simulation Product Specialist
Computer Aided Technology, Inc.