SOLIDWORKS 2017 What’s New: Simulation Results Processing - #SW2017
Simulation Results Processing
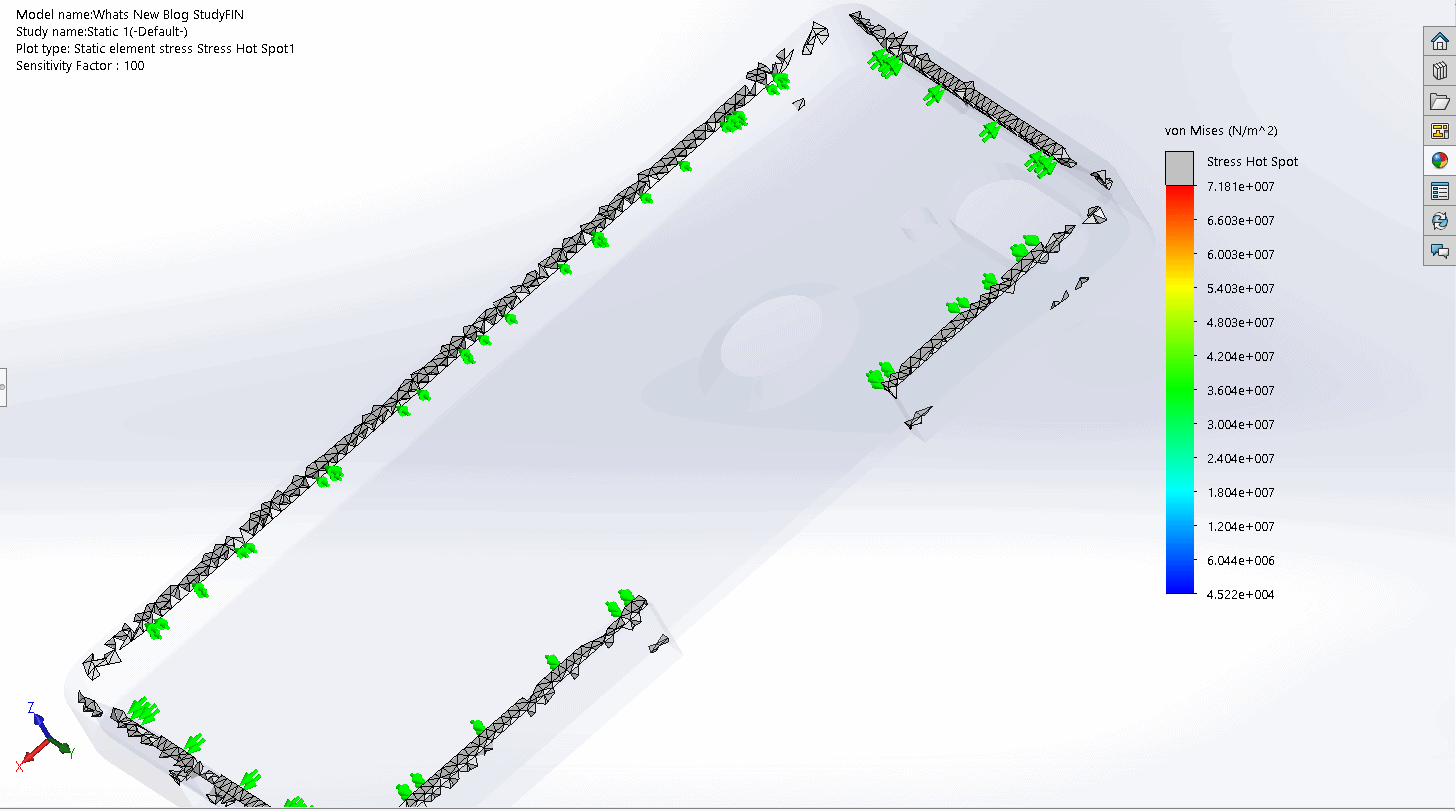
This article is a continuation of the article posted earlier this month regarding the new Stress Hot Spot Feature. The previous article showed how a college student designing their own phone case simulated how the case would act under loading. Below is what the Stress Hot Spot Feature came up with.
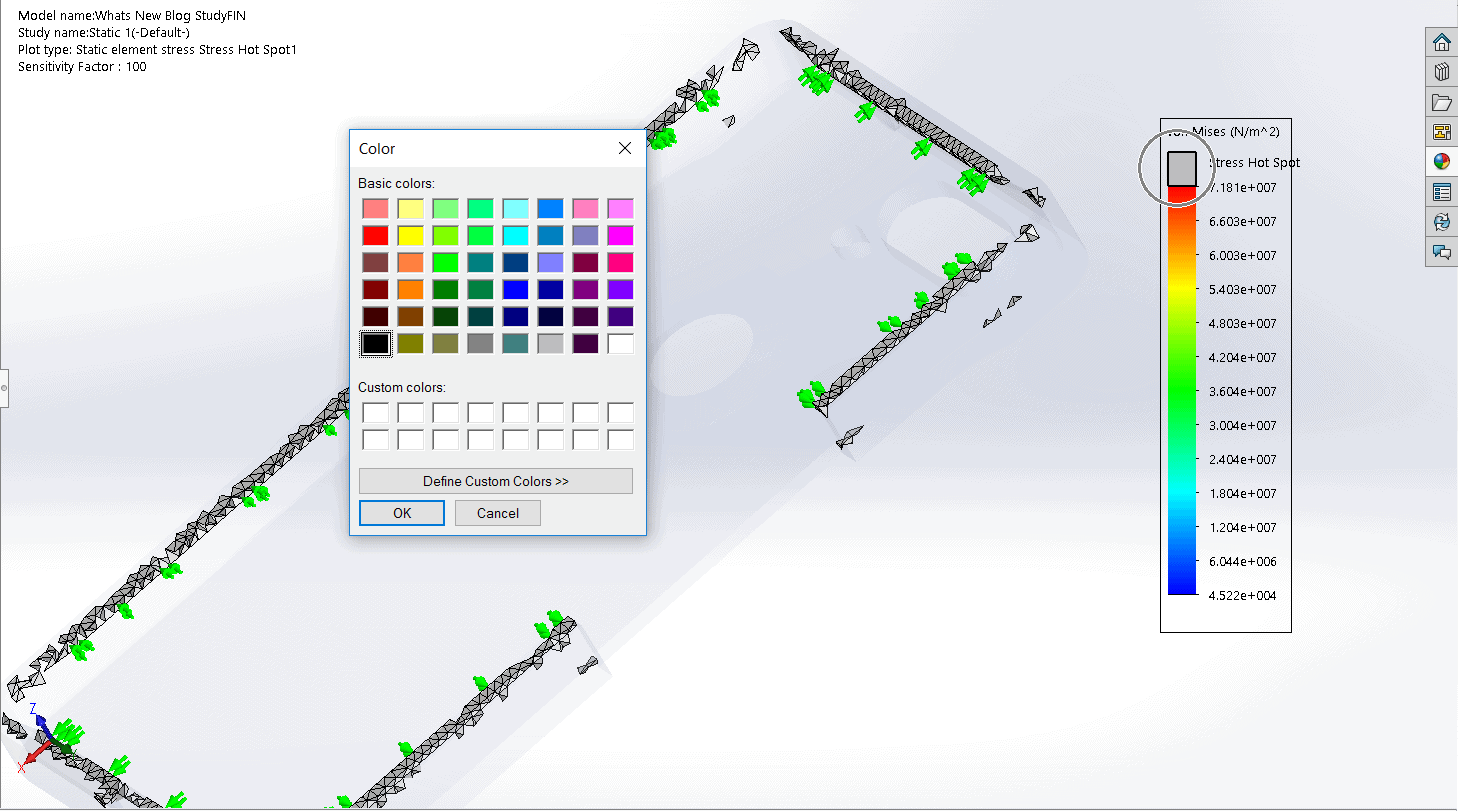
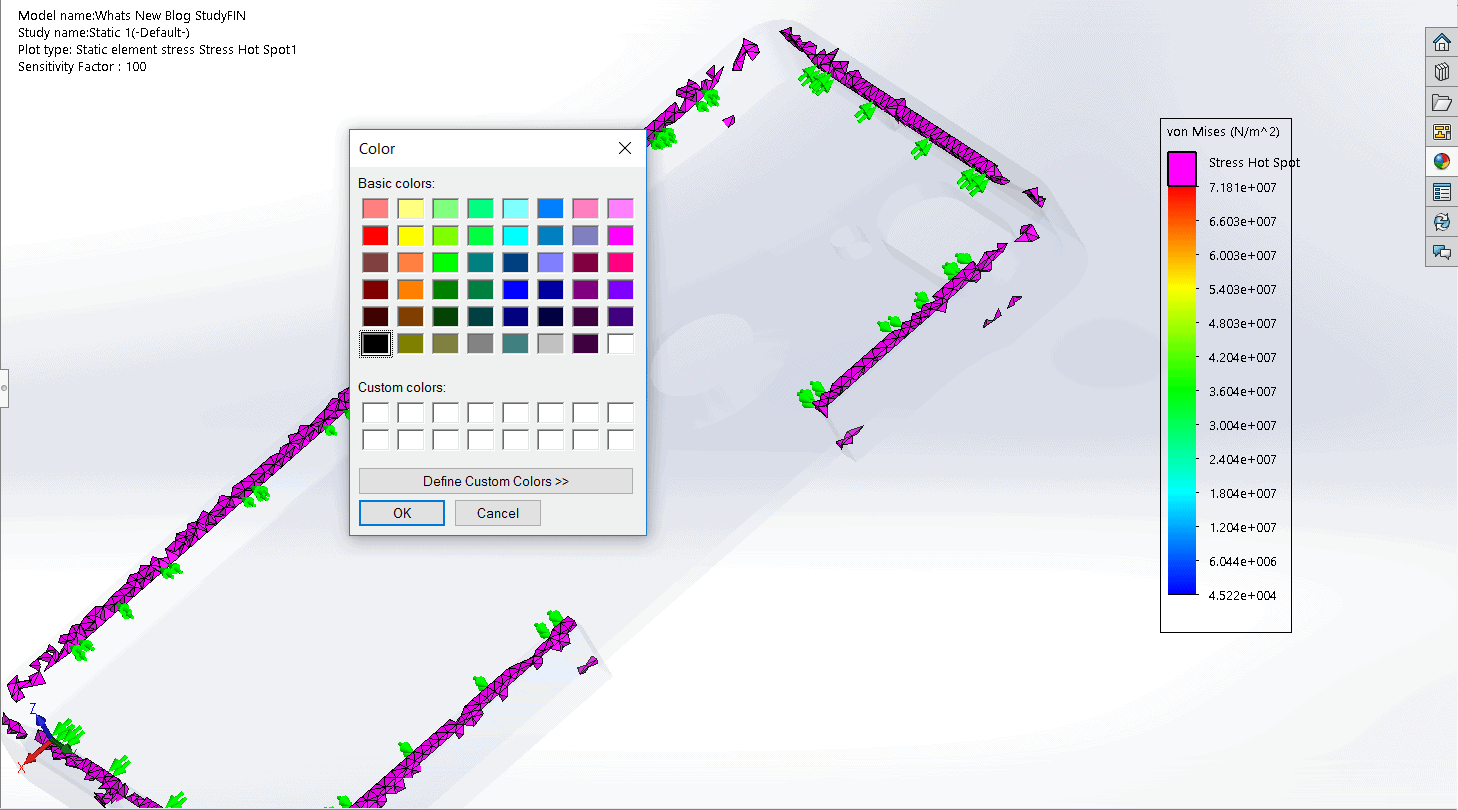
By setting a maximum value for our stress plot, we can specify the color that we want values above that to be. This is done by clicking the top of the color gradient on our plot key.
This feature in SOLIDWORKS 2017 makes for easier communication and results visualization, but there are a other features that can help communicate your Simulation results as well!!
You can now do mixed Simulation Display for some parts while displaying other parts with RealView or OpenGL. Simply go to toggle the display settings and see the Simulation Results available.
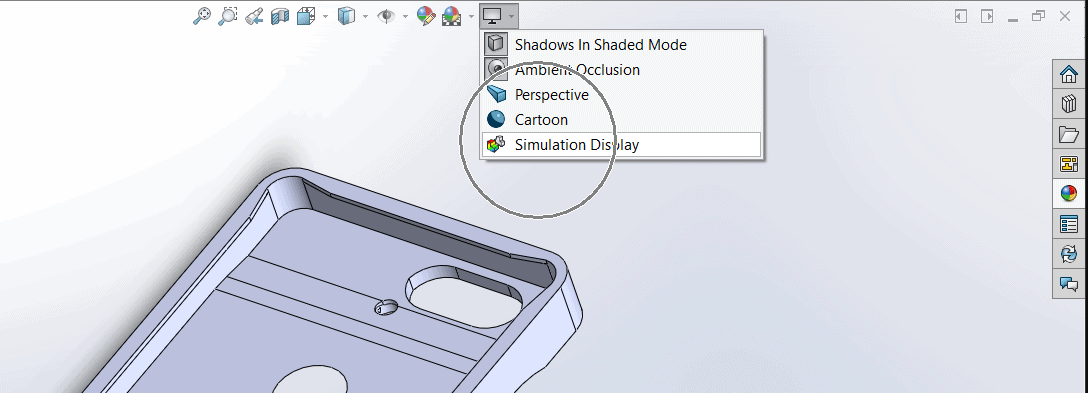
This feature allows you to view results for more than just stress plots. Simply click the simulation plot you want to display from the dialogue box and it will be transposed to your model view.
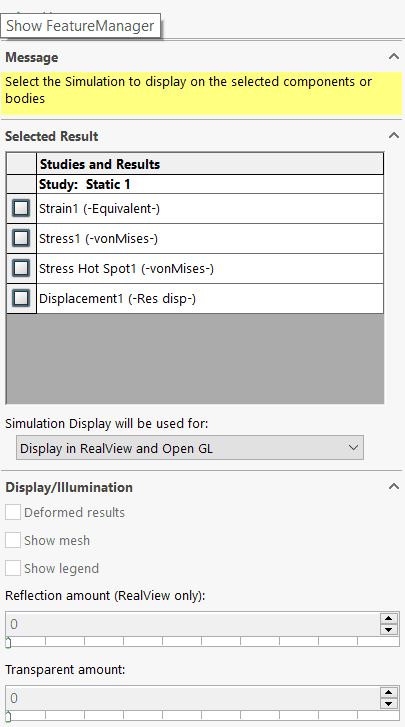
There are many options for communicating your simulation results including displaying the mesh and the deformed results.
We hope this part of the What’s New series gives you a better understanding of the new features and functions of SOLIDWORKS 2017. Please check back to the CATI Blog as the CATI and MCAD Support Teams will continue to break down many of the new items in SOLIDWORKS 2017. All of these articles will be stored in the category of “SOLIDWORKS What’s New.” You can also learn more about SOLIDWORKS 2017 by clicking on the image below to register for one of CATI’s or CATI’s Design Summit’s.
Matt Sherak
Application Engineer
Computer Aided Technology